First, the recent Department of Education report indicates that the difference between Black-White student suspensions starts as early as pre-school. Graph 1 shows that data as presented in the original report. The first column shows basic differences in pre-school enrollment between various race/ethnic groups in 2011-2012, and subsequent columns show rates of suspension, also divided by race/ethnic group, the first-tie such data was collected at the pre-school level. The original data can be found at the Dept of Ed web site. While state-level data is available, unfortunately, it is not in a single spreadsheet, but reported separately for each state, so the process of compiling state-level dataset for all 50 states is tedious, but it is what I use for the analysis below. Using the difference between enrollment and suspensions, I create a variable, "Black student suspension ratio," which is the level of suspensions as measured against enrollment. For example, in the national pre-school graphic below, Black student enrollment is 18%, while Black student 'Out-of-school suspension (multiple) is 48%, leading to a ratio of 267%--i.e., Black students were suspended at a rate of 267% more than their enrollment. Conversely, White student enrollment was at 43%, while suspensions were at 26%, leading to a ratio of 60%--i.e., White students were suspended at a rate of 60% of their enrollment. An 'individual-level' interpretation of this data might be 'White students misbehave at far lower rates than Black students,' presuming that no racial discrimination occurs in the process of assigning student suspensions. The following analysis tests that hypothesis--or rather, tests whether structural-level factors provide a better explanation for individual-level factors
As Graph 2 shows, also directly from the Dept of Education report, racial disparities in student suspensions occur beyond the pre-school level. The data I use for this analysis relies on the reported suspensions for all grade levels. Graph 3, which I have produced using Microsoft Excel, is an "area graph" that compares two variables at the state-level--the Black student suspension ratio (blue, indexed to the left along the y-axis) and the percent of Black state legislators (orange, indexed to the right). I also had Excel plot a trendline for both of these variables, which is the dotted line above the colored areas. One can notice several things from this graphic. First, I have sorted the state data from lowest to highest rate of Black student suspension ratio, with Maryland having the lowest rate, and Minnesota having the highest rate. Comparing this with % Black state legislators, a general trend can be seen--the higher the % of Black state legislators, the lower the rate of Black student suspensions, and vice-versa. This does not necessarily imply causation, but a relationship is apparent (more about this later). Second, one might notice that all 50 states are not represented on this graphic. One of the problems with voluntary data collection is that not all states report. In this case, many states simply did not report suspension data. I have not attempted to impute or recover missing data in this analysis, but use only the data reported to the Department of Education for 2009-2010.


Graph 4 shows a scatterplot of this same data--also using Excel. In this case, the presumed independent variable, % of Black legislators, is reported on the x-axis, and the presumed dependent variable, Black student suspension ratio, is reported on the y-axis for this plot. Each dot represents a state. The correlation is reported on the graphic as -0.68, which is a strong negative relationship between these variables. This means that as the % of Black state legislators increases, the ratio of Black student suspensions go down, and vice versa. The trendline helps visualize that pattern. Interpreting the relationship between these variables require additional data and hypothesis testing, and in class I facilitate a brain-storming session, where the students come up with various explanations, each of which, I clarify, become 'testable hypotheses' that typically require the collection or analysis of additional data to decide which hypothesis among them has the strongest support. In this case, my personal hypothesis is that political representation grants a greater level of equality at the group-level. In other words, states where the Black population has more political representation at the state legislative level, have a greater capacity for the implementation of policies that ensure the implementation of racially-fair policies in schools. Alternatively, or reciprocally, the greater percent of Black legislators can also imply that group has, in general, a greater reserve of organizational capacity and community-level political activism, which can be seen in agitation for equal treatment in local schools.

The next variable I add into this analysis is data from the 2010 American Community Survey, specifically, a comparison between Black median income, and White median income. Just as the comparison of Black suspensions vs Black enrollment generates a ratio, the income data also generates a ratio that can be plotted. Graph 5 shows the scatter plot between the presumed independent variable on the x-axis, Black-White median income ratio, vs the presumed dependent variable on the y-axis, Black student suspension ratio. As above, each dot represents a state. For example, in the top left-hand corner is a dot that represents Minnesota, with the highest Black student suspension ratio for those states reporting, with 582%, meaning that Black students are suspended at almost 6x their rate of enrollment, as well as the lowest Black-White median income ratio of all states, with 48%, meaning that the average Black worker in Minnesota makes less than half of the average White worker. The state with the highest (most equal) Black-White median income ratio is Arizona, where the average Black worker makes 78% of the average White worker, and are also represented on the lower half of Black student suspension (197%). Like the graph above, for % Black state legislators vs. Black student suspensions, there is a negative relationship between these variables (r=-0.54), meaning that the lower the Black-White median income (i.e., the lower the level of racial income equality), the higher the Black student suspension ratio. Like the in-class process above, I show this graph to the students and facilitate a brain-storming session where they come up with various testable-hypotheses to explain the relationship between these variables.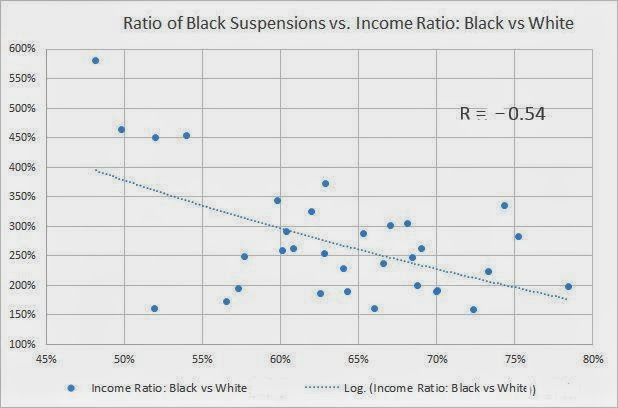
It is important to remember that correlation never implies causation. Like the fundamental attribution error mentioned above, when we intuitively 'want' variables to be related by causation, we tend to see the above graphs and presume that % state legislators, and income inequality are contributing to causing unequal Black student suspension ratios. However, since correlation never implies causation, we must resist the urge to presume a causative mechanism. On the other hand, regression analysis, a separate (but mathematically related) statistical process, can be used to imply causation. In this final section, I pull together all three of these variables into 'multiple regression.' While I typically do not personally use the IBM software SPSS for my statistics (I use the open-source software R), SPSS has a relatively easy learning curve, and is available at our campus bookstore (and online) for the IUPUI students, so for the in-class example, I use SPSS to generate the graphic for this analysis, and walk the students through the meaning of several of the key output statistics. The equation for this model, roughly is thus:
Black student suspension ratio = X * % Black state legislators + Y * Black/White Median income ratio
The implication, based on the above correlations, is that there is a relationship between these three structural-level variables. Further, the mathematical/social interpretation of regression, if found to be statistically significant, is that causation can be implied between the independent variables (% Black legislators and Black/White income disparity) and the dependent variable (Black suspensions), which makes it a fundamentally more useful analysis than simple correlation, where causation cannot be implied. In the SPSS output show, I have circled several important parts. First, the "Adjusted R Square" of 0.713 implies that around 71% of the variation in Black student suspension rates in the Unites States can be explained *SOLELY* by these two structural variables of political representation and racial income inequality. Put more clearly, one does not need to presume individual causation in order to obtain a reasonable prediction of what a state's Black student suspension rate will be--i.e., one does not need the (implicitly racist) original hypothesis that "Black students misbehave at higher rates than White students" to explain Black student suspensions. The implication of this is that persistent racial discrimination is adequate to explain the differential rates of suspensions, and not "individual student" factors. What may, at first intuition, seem to have relatively little relationship with school suspension rates--political representation and income inequality--turn out to be powerful predictors, and, in fact, causative forces. Second, and finally, for this "brief introduction" to SPSS for my intro class, I also have them look at the "Standardized Coefficients-Beta" column in the graphic. Respectively, they are -0.665, and -0.703. Without going into a complicated discussion of how to interpret these numbers, they imply that both of these independent variables contribute approximately equally to the Black student suspension ratios, and both are related in negative ways. In other words, like the correlation results, the 'negative' relationship implies that as % Black legislators, and income equality ratio goes up, that Black student suspensions go down, and vice versa, and both of these factors have approximately equivalent causative force. If, for example, % Black legislators had been -0.3. while income ratio had been -0.9, it would imply that income ratio is far better predictor, about 3x more important, than % Black legislators. Here, however, the numbers are close, implying similar levels of predictive use. 
For book-length treatments of these issues, I have used two relevant ethnographies in various classes. First, Bad Boys: Public Schools in the Making of Black Masculinity , by Ann Ferguson, who studied the ways that Black and White students were treated differentially in the classroom. Second, a more recent contribution from a Berkeley researcher, Punished: Policing the Lives of Black and Latino Boys , by Victor Rios, who embedded himself with youth in Oakland, CA.
No comments:
Post a Comment