Saturday, October 15, 2016

Presidential Polling Since the "Trump-Tapes"

This is a quick data note. Since the release of the vulgar "Trump Tapes" from 2005, there has largely been a perception that Trump is out of the race, with unsubstantiated (and subsequently refuted) rumors of Pence dropping off of the ticket. Indeed, he has been abandoned by even more Republicans (many "establishment" Republicans had already refused to support him prior to this). However, current polling doesn't necessarily indicate a voter groundswell different from the weeks prior to the release of the tapes.

I've been struggling with how to create an easy-to-read graph of the polling of these changes. On the one hand, the polling has been reasonably consistent that Clinton has a far better chance of winning the electoral vote than Trump, even prior to the release of the tapes. As of October 3rd, Nate Silver's forecast gave Clinton a 72% chance of winning. The tapes came out Friday, Oct 7th, and post-release polling largely wouldn't have been released until either Monday or Tuesday. To be safe, I looked at polling released starting on Tuesday, Oct 11th. The graph I created shows 4 time periods-the first is the Romney-Obama election win margins of 2012, the second is 2016 polling up through Sept 28 (the first debate), the third time-period is from Sept 29-October 10, and the last is polling since Oct 11th. Negative values (below the 0 mark) represents a lead for Republicans, and positive values (above 0) represent a lead for Democrats.

Comparing the Obama-Romney win to pre-October polling, Utah, Texas and Arizona are the most obvious "Republican" states who shifted the most. This was up to and including results from the first presidential debate, and all show fairly radical shifts towards Clinton. Some other states, like North Carolina, Virginia, Michigan and Maine also showed some movement, with NC & VA showing movement in Clinton's direction, while MI and ME showing moves towards Trump. Somewhat more surprisingly, the Utah, Texas and Arizona shifts seem to be holding as of October 15th polling, even shifting further towards Clinton--AZ continues to poll (narrowly) for Clinton, and the NC polling for Clinton is even stronger. Whereas Romney won TX with a 38% margin, Trump has been polling with only a single-digit, decreasing lead. Other states, like Michigan and Maine, are firmly now in the Clinton camp.

However, the Trump tapes so far are not showing a large impact in these specific states. The graph only includes states where polling has been done since Oct 11th. While there does seem to be some movement in Clinton's direction in several states, the change is slight, and within the margin of error in every case except Michigan. In fact, Florida, Pennsylvania & Wisconsin evidenced a shift in Trump's favor from the two-week period after the first debate, but before the release of the Trump tapes, to the week following the release of the tapes (these shifts are also within the margin of error, but at least 2% in Trump's favor--certainly not the expected shift towards Clinton following the tape release).

Tuesday, September 6, 2016

WaPo-SurveyMonkey All-State Polling for President

The Washington Post teamed up with SurveyMonkey to do polling of all 50 states on the presidential race, and they released the results today. The table to the right shows those results in the column labelled, "2016: WAPO, Sept 6." You can compare this with the 2012 actual state-level results between Romney and Obama, and in the final column, a summary of polling average so far this year (since July). There are very few surprises, although there are some, which I have highlighted. For 36 states, earlier polling (where it's been done) matches WaPo polling, which matches the 2012 election results. There are 14 states where we see some differences. The table is sorted by the WaPo results--Clinton's highest leads are on top, going all the way to her biggest losses at the bottom. Regardless, the 2012 results and the WaPo polls are fairly close, with a correlation of r=+0.92.

First, there are some differences between the 2012 race and the WaPo polling, which I have highlighted in yellow. Not all of these differences are Dems vs GOP, but rather, differences is amount. For example, Rhode Island has no surprises in their choice--Democrats. However, in 2012 Obama won Rhode Island by 27 points, and currently, Hillary is polling at a 10 point lead over Trump. Similarly, in 2012, Romney won Utah by a whopping 47%, but Trump only has an 11 point lead in this WaPo poll. Earlier polling showed his lead at 20 points.

Second, depending on the quality of this WaPo poll, it shows a reversal in a few states, like Mississippi, Arizona, & Iowa. On the one hand, Clinton's 1 point lead in Arizona is within the margin of error, so somewhat meaningless. But on the other hand, Romney won Arizona by 9 points in 2012. Other polling shows a similarly tight race as the WaPo poll, showing Trump with just a 1 point lead. What is more curious is Mississippi, where WaPo shows Clinton with a 3 point lead, and Iowa, which shows Trump with a 4 point lead. Both of these would represent reversals from 2012. I can perhaps buy the Iowa switch--I'm far more skeptical about a Mississippi switch to Democrats. However, earlier polling has already shown Trump and Clinton tied in Mississippi--in 2012, Romney won here by 11 points. Perhaps this GOP stronghold is turning purple?!

Third, there are also a few significant differences in today's WaPo results and earlier polling, although only one is a "switch," Ohio--earlier polling gave Clinton an average of a 4 point lead, while today's WaPo results give Trump a 3 point lead. These results would be within the margin of error, so the differences are largely uninteresting, but similarly, unhelpful in predicting a winner, other than to say, "it's likely to be close." Two states, Colorado and Wisconsin, had Clinton with a 10 point lead in earlier polls, but today's results give her only a 2 point lead. The latter results puts it in the margin of error, so could be a significantly tightening rate there.

Just for funzies, let's use the WaPo results as a blueprint, and see what it would produce in terms of an electoral result (neither Texas nor DC were in this poll--for the sake of argument, let's give Texas to Trump, and DC to Clinton--polling averages give Trump an 8 point lead in Texas). First, if we use it "as is," ignoring margin of error, and leaving out Georgia and North Carolina, where polling has a dead heat (0), Clinton gets 325 electoral votes, Trump with 182--a landslide for Clinton. Second, let's only use states where candidates have a 5 point or more lead--That gives Clinton 224, and Trump 158. At the 5-point cutoff, Clinton doesn't garner enough electoral votes to reach the required 270, although, with a 66 point advantage, we still have a reasonably likely Clinton win. In this scenario, she only needs a couple of the states that Obama won in 2012, like Florida+Pennsylvania. Trump's path is far more difficult--he would need to win most of these 11 states. For example, if he lost both Florida and Pennsylvania, he only gets to 265 electoral votes. Or, if we combine a 2012 Obama with with earlier pro-Clinton polling, say, if Trump loses Ohio, Michigan, Wisconsin, and Colorado, Clinton wins. In all, a Trump win is still a statistical possibility, but the path forward for Clinton continues to be far more mathematically obvious.

Saturday, September 3, 2016

US Senate Race 2016

So far my 2016 political analysis has been about the presidential race. Now that all of the Senate primaries are over (except Louisiana--they have that weird "jungle primary," which isn't until election day), it's time to see how the field is lining up. While most Senate primaries were significantly earlier in the year, of the 34 seats up for grabs, 9 weren't until last month, and 2 of those (Arizona & Florida), weren't until August 30th.

Currently the Senate is in Republican hands, with a margin of 54 to 46 (technically, there are two Independents, although both of those caucus with Democrats: Bernie Sanders & Angus King). However, that lead will almost certainly shrink after the November election. Regardless of any purported "drag" effect from Trump, Republicans in this election are defending 24 seats, while Democrats are defending just 10. Historically, it's harder to defend this many seats without losing more than you gain.

This year, Democrats merely have to take 5 seats from Republicans, while holding onto all of their current seats, to gain a slim majority, and so far they have a good chance of doing just that, according to Larry Sabato, political scientist at University of Virginia, who runs the UVA's Center for Politics. His analysis shows that all of the Democrat seats are safe, except for Nevada, where Senate Minority Leader, Harry Reid, is retiring, and that race is currently too close to call. In contrast, of the 24 Republican Senators up for re-election, Sabato says that 2 are "likely" to lose to Democrats (Wisconsin & Illinois), while 3 are "leaning" Democratic (Indiana, New Hampshire & Pennsylvania). While the Indiana race would not have originally been very competitive, with the entry into the race of Evan Bayh, a popular former Indiana Governor, the race is now polling significantly in his favor--the most recent polls have him up an average of 17% over his challenger.

In fact, depending on who wins the presidency, and it strongly looks like it will be Clinton, the Democrats really just have to win 4 seats, since that would give them a tie, and Vice President Kaine would presumably break any ties in favor of Democrats. That means that even if the Nevada Senate seat goes to a Republican, but the rest of the seats go in the direction of current polling, Democrats will technically control the Senate. In any case Democratic hold over the Senate would be tenuous, with either a 50-50 tie, or 51-49 as the most likely scenario.

August polling seems to support Sabato's assessment. The table shows all of the state-level polling since August 10th. Red indicates Republican, blue indicates Democrat. The 3rd column, "Curr," indicates which party currently holds that seat. The bottom section of the table are the seats that Sabato calls "safe." Indeed, most pollsters haven't even bothered to survey these states. The few that have (Colorado, New York, South Carolina & Utah) show that these seats should remain safely in the hands of the current party. The middle section of the table are those seats that Sabato says are "likely" to go to a given party. Polling results, on the right-hand side of the table, are clearly smaller margins than the "safe" seats, but the designation of "likely" also seems fair for both Wisconsin and Iowa, the only two states in the "likely" category for which polling exists since August 10th.

The top section of the table is where Sabato calls the seats "leans," plus the one toss-up, Nevada. The polling in yellow are results that were obtained prior to those state's primaries (designated in the middle column labelled "Prim")--in this case, just Arizona & Florida. While McCain's (AZ) early lead seemed quite large (13%), the only poll since the August 30th primary shows that race is currently tied.

The "lighter" red and blue are polling results that are between 3-5% for Republicans or Democrats, respectively, which I would consider "weak" leads, if at all, since these are likely within the margin of error. The green poll results are within 0-2%, or basically just a tie. My assessment of the polling tends to match Sabato's.

Current state-level polling, and the UVA's politics site both seem to indicate that Democrats have a good chance of taking the Senate in November, either with a tie, or at most, a 51-49 lead. What seems less likely, is the coincident situation that Reid's seat remains in Democrat hands, AND McCain's seat also falls to Democrats. But even then, the Democrat win margin would only be 52-48, a long way from a filibuster-proof majority. And either way, there are few analyses that are predicting a Democratic win for the House, undoubtedly leading to a bitter 2 years (if not 4) of Democratic & Republican wrangling for control of the federal budget & political system.

Presidential Polling: End of August Round-Up

For this election season I've been comparing state-level pre-election polling in earlier presidential elections to who actually won the election. By May, in previous elections, the polls become reasonably predictive, and by late July, polls give us an almost certainty of who will win that state. Even though many polls are, in a scientific sense, still within the margin of error, they have still ended up trending in the direction of the actual winner. As I showed in my last post summarizing the early August polling of the 15 states that are most likely to be called "battleground states," Trump seems to have very little chance of winning this year's presidential election. Historically, or at least since WWII, voters in the US seem to like to switch presidential parties every 8 years. Keeping the same party in power for a "3rd term" is very rare. This year seems like it will break that rule, and not only keep Democrats in the White House, but the drag of Trump at the head of the ticket may give Democrats the Senate, and significantly shrink the Republican's control of the House.

This state-level poll round-up is from August 20-Sept 2, and I have only included the 13 states for which there has been polling which either Romney or Obama won with less than 10% margin in 2012 (except SC, which Romney won with 10.5%, and NM, which Obama won with 10.1%), ie, "battleground" states. The table shows each of the 13 states, their electoral votes, the 2012 Romney-Obama win margins, the early August (2016) polling results, and in the final column, polls since August 20th. In all cases except for Florida and North Carolina, the trend seems to be a shift in Trump's favor. Not nearly enough to win him the election at this point, but all of the states where Clinton was ahead in early August, now show a smaller lead, and the states where Trump was ahead, now show larger leads. In fact, Iowa, while still within the margin of error, has shifted to the Trump camp.

In each of these cases, all of the polls for these 13 states are still showing within the margin of error, except for a few oddities. For example, on August 23rd, two universities generated polls showing incredibly strong leads for Clinton: Saint Leo gave her a 14% lead in Florida, and Roanoke a 19% lead in Virginia. Later polls by other sources gave both states to Clinton with a 1-2% margin. Thus, the size of the Clinton leads shown in this table for those two states should be viewed suspiciously. The outcomes are consistent with each other, and with the previous polling in these states, but not the size of the leads--ie, they all still show Clinton winning these states.

In a similar trend, the polling margin wins are getting closer to the Obama-Romney win margins in 2012. For example, in early August, polls gave Wisconsin to Clinton by 15%, and now by 5%, far closer to the 7% win by Obama in 2012. On the other hand, Trump's polling in these battleground states are still far from Romney's win margins. In each case, even though his lead seems to have grown since early August, he is winning these states by less than 4%, whereas Romney won South Carolina, Missouri, and Arizona by almost 10%.

If there is any trend in this data, it's in Trump's favor. However, all of this was before his Mexico visit + Arizona speech debacle, and his various surrogate crises from just the last few days: a disgraced, lying pastor, the promise of a "taco truck on every corner if Trump doesn't win", and increasingly public abandonment of Trump by the Republican Party leadership, including senators trying to hold onto their jobs. While state-level races seem to mirror the national polling, a tightening of the race, there is still no evidence that Trump can win states that Romney lost in 2012. The problem for Trump has been the same since I started these analyses in July--the presidential race isn't national, it's state-by-state, and most states' electoral votes are already locked into a party by demographics and history. The battleground states that Trump must switch from purple to red, simply are not polling in his favor, and none of his rhetoric, surrogates, or campaign behavior seem to be doing anything but pushing these states away from him.

Tuesday, August 23, 2016

Presidential State Polling--Aug 23

Several new state polls are out today for the Trump-Clinton presidential election. If one can take them at face value, they are stunning. On the one hand, what is unsurprising is that Trump leads in Utah, by what sounds like a yuuuuge margin, 20%, according to a Saint Leo University poll. However, the size of that lead is actually bad news for Trump--Romney beat Obama in Utah by almost 50% in 2012. Worse, that number drops to a 15% lead for Trump once you add in the Libertarian candidate, Gary Johnson, who seems to be on the ballot in all 50 states (feel free to correct me if this is wrong).

Similarly, it is unsurprising that Trump is ahead in Missouri, according to a Monmouth University poll, but only by 1%. Again, in 2012, Romney beat Obama by almost 10%. Trump's 1% lead is well within the margin of error, so actually a statistical tie.

Here is where things get stunning, in case the 'more than halving' of Romney's lead in Utah wasn't enough--Roanoke University shows Clinton ahead by 19% in Virginia, and Saint Leo's shows her ahead in Florida by 14%! The former, Obama won by barely 4% against Romney in 2012, and the latter was close to a tie in 2012, with Obama beating Romney by less than 1%. Let's say you cut these leads by 1/2, or even 2/3--they are still outside of the margin of error, and they would still be larger wins than Obama got in 2012.

Last week I showed that the early August polling (Aug 1-20) was extremely predictive of who actually won that state, with a correlation value of r > 0.9. To put that into context, social scientists typically get excited about r > 0.5, with 1.0 being the highest possible value. I haven't looked back to see if late August polling gets worse or better. But I can't imagine these new polls are anything but disastrous not only for Trump's prospects for presidents, but also for the down-ballot races.

Sunday, August 21, 2016

Anti-Gay Church Moves into the Gayborhood

The IndyStar recently had an article about Traders Point Christian Church (TPCC), which has purchased a large facility in downtown Indianapolis, and has already started holding religious meetings. The exurban-style megachurch has a long history in Whitestown, in Boone County, but recently expanded to Carmel, and now to the near-northside, on North Delaware. While there is no true "gayborhood" in Indianapolis, like Castro in San Francisco, Chelsea in New York, and West Hollywood in Los Angeles, the area around Massachusetts Avenue is about the closest there is, with a history of a number of gay-owned, gay-themed businesses, as well as a high concentration of openly gay residents. This is the neighborhood where, just last year, an anti-gay bakery had a short-lived existence--opening shop, refusing to make a gay wedding cake (whatever a "gay wedding cake" is), and then closed due to an abrupt end to their customer base. This is where TPCC has decided to open its own shop.

The United States has a long history of using religion to persecute various minorities that it deems morally unacceptable, or just plain inferior. Let's ignore the way that Christianity was used to approve and solidify the legal standing of slavery for Black Americans, Native American massacres, "witch" massacres, and the subordination of women. I doubt TPCC would, today, support any of these positions. In fact, the Stone-Campbell movement, of which TPCC is an offshoot, has a history of anti-racism here in Indianapolis. Ovid Butler, founder of North Western Christian University, which later became Butler University, was a strong opponent to slavery. He worked with a Stone-Campbell church, Second Christian Church, which, according to Emma Lou Thornbrough (the late historian from Butler University), was "founded during the Civil war as a mission church for freedmen, ... [and] was one of the most influential black churches in Indianapolis" (p 18). Butler University itself originally had a seminary feeder for the Stone-Campbell movement, until that department broke off to form it's own separate entity, which continues as a Disciple of Christ institution, Christian Theological Seminary.

However, that history is for the "liberal" branch of the Stone-Campbell movement (the Disciples of Christ). TPCC is from the middle-branch, not the most conservative of the branches (that title belongs to the non-instrumentalist congregations), but still theologically very conservative. Many theologically conservative churches continue our country's ideal of a separation of church and state, holding to Augustine's "two cities" paradigm (secular institutions are fundamentally different from godly institutions), as well as Tertullian's famous rhetorical question, "What has Jerusalem to do with Athens?", which was always the Evangelical approach to politics until around the 1970s. However, with the religious-political movement known as the Religious Right, the "Christian Churches/Churches of Christ" (the "middle" branch of the Stone-Campbell movement) has largely been far more active in trying to impact the political system, with a goal of reshaping secular, pluralistic life into their religious vision. TPCC is no exception to this.

On the one hand, TPCC has every right to teach and preach in its churches whatever it deems theologically appropriate, and it does so. For example, on their "Resources" web page, they sell two books (one wonders what Jesus would think about this) that affirm and explain their anti-gay theology in detail, one by Kevin Deyoung, who believes that LGBTQ people are the moral equivalent to pedophiles and people who have sex with animals (engage in bestiality), and another by Sam Allberry.

Similarly, on their "Beliefs" page they specifically highlight an anti-gay paragraph about what they think God's intent for marriage is:

We believe that the term “marriage” has only one meaning: the uniting of one man and one woman in a single, exclusive union, as described in Genesis 2:18-25. We believe that God intends sexual intimacy to occur only between a man and a woman who are married to each other (1 Corinthians 6:18; 7:2-5; Hebrews 13:4). We believe that God has commanded that no intimate sexual activity be engaged in outside of a marriage between a man and a woman.
While many contemporary churches would consider private beliefs about sexual orientation to be part of an individual's conscience, much like beliefs about capital punishment, war, guns, etc, this church believes so strongly in their anti-gay theology, that it has become part of their core theological system, from which they allow no deviation. In many areas of the country, perhaps even Whitestown, IN, this dogmatic position may be acceptable. However, when moving into a largely pro-gay community, this level of anti-gay dogmatism is unlikely to be received well.

What will also not likely be well-received is their promotion of the long-ago discredited "ex-gay therapy." In fact, in 2007, TPCC hosted a national "Love Won Out" conference. The history of this organization is somewhat complicated. Early on it became an arm of James Dobson's organization, Focus on the Family, but was then taken over by Exodus International, an ex-gay support network. The LWO conferences were designed to encourage gay people to "become straight," to encourage participants to engage in anti-gay activism, and trained parents how to tell if their children were gay so they could send them to Christian therapists to be "fixed." All of the licensing mental health organizations, as well the primary licensing medical organizations had, by 2007, issued institutional statements clarifying that not only was "ex-gay therapy" not effective, but that it was largely harmful, for example the American Psychological Association, the National Association of Social Workers, the American Academy of Pediatrics, and the American Counseling Association. This type of "therapy" has been banned in several states.

However, all of the preceding discussion is what they do inside their church walls. What is far more problematic is their secular political activism on this issue. Specifically, the church's relationship with Curt Smith, a current "team leader" for the Indiana Family Institute, and IFI's former president. At issue is the core part that Smith has played in both of these institutions. In addition to his activities with IFI, Smith "attends Traders Point Christian Church in northwest Indianapolis, where he served as an elder for 14 years and was Chairman of the Board from 2005 until 2008." His past and present relationship with TPCC is not trivial, nor is it coincidental. The church has anti-gay theology as one of its core beliefs, which is also one of the three core beliefs of the IFI. But more than just holding and promoting a system of religious beliefs, the IFI's primary mission is to create political change, shaping our pluralistic society into their own theological vision.

A primary example is their participation in the recent Indiana "Religious Freedom Restoration Act" debacle. In this image, governor Mike Pence is shown signing RFRA, surrounded by many of the state's religiously-affiliated anti-gay activists. Smith is in the back row, representing the IFI, one of the key actors in this statewide (and later national) drama.

While the strength of the backlash eventually caused Pence and the legislators to add a "fix," reducing its enforceability, Smith opposed any changes to the law they originally passed. In fact, in a recent book about Evangelicals' requirement to engage our society to a move towards theologically conservative political & legislative changes, he implies that Mike Pence is a New Testament Judas, selling out those religious-political activists who spent a significant amount of time, money, and political capital to get the original RFRA passed, yet Pence signed the "fix." Like the author of the anti-gay books sold on the TPCC web site, Smith also believes that gay people are the moral equivalent to pedophiles and supports the banned ex-gay "therapy."

Similarly, not satisfied with keeping their political beliefs inside the walls of their congregation, pastors at the church advocate for political opposition to basic gay civil liberties. For example, here, and here, the lead pastor, Aaron Brockett, tweeted links to anti-gay news articles. The downtown congregation will have a their own pastor, Petie Kinder, with a similar penchant for tweeting anti-gay articles, for example, here and here. Again, while this type of rhetoric may bring in the politically-conservative residents of Boone County, my guess is they will have an uphill battle bringing an anti-gay message into the gayborhood around Mass Ave, and may go the way of the anti-gay bakery.

Finally, on a slightly different note, all of this came to my attention by way of a discussion on NextDoor, when one of my neighbors posted about the fact that the church had purchased one of the old buildings for its new church plant. When I posted about the irony of the anti-gay church moving into this particular neighborhood, my post was flagged as inappropriate and deleted. It started an interesting conversation that seemed to contain three types of people--one that was concerned about the "outdated" theology the church was propagating, another that agreed with the church's theology and welcomed them, and a third that was annoyed by any talk of the theological, but were simply excited about the economic impact of a megachurch moving into a building in their neighborhood (perhaps they will put a Starbucks in the lobby?). After my post was deleted, I appealed the decision to the company, who affirmed that my contribution was unacceptable. I promptly deleted my account with NextDoor.

[Edit: In a previous version of this, I mistakenly associated online anti-gay sermons by Jeremy Paschall with Traders Point Christian Church, when in fact, he is associated with Traders Point Church Of Christ. I have deleted this reference]

Thursday, August 18, 2016

Presidential Election & Polls: Mid-August Update, Battleground States

In early July I posted a 2012 presidential election analysis, comparing state-level outcomes of the election for the "battleground states" with polling from May-July 15 of that year, and found that polling even that early was an excellent indicator of who would win that state: looking only at PPP polling, they correctly predicted 13 of the 15 states, and by taking an average of just 3 polls from that time period, you could correctly predict all 15 states. This post updates a look at the polls from those same 15 states from a post two weeks ago, which looked at the polls up through Aug 5. At that point Clinton seemed to be in a good position. Now she looks even better.

Looking again at the 2012 presidential election, I broadened the number of states included in the analysis, from the original 15, now to 23. Originally I only looked at states that were won with a 10% margin, now I include states won with a 15% margin. Averaging all polls that only included "likely voters" (and PPP, which uses "registered voters", but is a highly reliable pollster) that were administered from Aug 1-Aug 20*, produced the results in Table 1. Comparing those averages with the actual win margin for either Romney or Obama produced a staggeringly high correlation: r=0.93. Usually social scientists get excited with r>0.5, and ecstatic for r>0.7. What r=0.93 indicates is an incredibly strong reliability between the August polling and the margin of the win. For example, the only poll on record for Montana for early August gave Romney a 17 pt win, and he won by 14%. Similarly, the only poll for Washington gave Obama a 17% win margin, and he won by 15%.

In the current election, various problems have arisen with the Trump campaign--largely because of continued inflammatory statements by Trump himself. While Clinton has some of the lowest "favorability" ratings of presidential nominees, she is still far ahead of Trump in the polls, and she is particularly cutting away at the leads that Trump needs to have in these battleground states. The data from current polls can be found in Table 2, which represent an average of all of the polls from Aug 1-Aug 18 for these states, where polls are available for this time frame. Polls were retrieved from RealClearPolitics and 270ToWin.

At a baseline, Trump needs to win all of the states that Romney won in 2012, plus more, in order to beat Clinton. In the table, I have highlighted in red the states that Romney won, and in blue the states that Obama won. Column 3 is the win margin for either candidate. The last column is the average of all August polls ("likely voters" only). Several states do not have any August polling yet, designated with "NA". In that column, I have highlighted in red those states where Trump leads with more than 5%, and in blue those states where Clinton leads with more than 5%. Green are those states with less than 5% win for either candidate. Recall that the 2012 August polling was highly predictive not only of who would win that state, but of the win margin. So even though the states here highlighted in green are largely within the margin of error, going by the 2012 results, they might still be predictive.

The problem for Trump at this point is that he is under water, and not just by a little bit. He is only winning one of these 23 battleground states by more than 5%, Indiana, based on just one poll. However, for what it's worth, a Democratic internal poll for Indiana actually shows that Clinton and Trump are tied. Clinton is winning seven of these states by by more than 8% according to these polls. Even a state like South Carolina, which has Trump in the lead by 2%, Romney won by more than 10%. Arizona has Clinton with a tiny lead, which Romney won by more than 9%, and he is tied with Clinton in Georgia. In Georgia!

While pundits have got this election wrong for the last year--mainly in predicting that Trump would never get as far as he did--none of those predictions were based on data (unless you count historical wisdom as data). In this case, polling is clearly on the side of Clinton, and at least in the 2012 election, it seems that the voters in these states had already made up their minds as of August, and polling detected it quite accurately. If pollsters are doing a similarly good job this year, and if voters are on the same cognitive-political timeline as in 2012, then Hillary should start measuring for White House drapes, unless the old ones are still in storage.

Thursday, August 4, 2016

Presidential Race--Early August Polling

Edit: I have included Florida in the analysis below, released Aug 5. This time last month I posted an analysis of the 2012 election polling (Romney vs Obama) for the 15 most likely "swing states"--those states that were eventually won by less than 10% by either candidate. I compared the 2012 late May-early July state-level polling to who actually won the election in November, concluding that even 4 months out, these polls were strongly predictive of the winner. Now that we are passed the conventions, a few new polls have come out, and things do not look good for Republican presidential chances, ie, Trump, which may also have a profound impact on down-ballot races. If the current trend holds, the GOP are likely to lose the Senate, and their hold on the House will significantly narrow not to mention state races. The Kansas primary has already shown that conservatives have lost their state-level seats to moderates.

Of the fifteen "swing states" from 2012, seven August polls have been released: Michigan, Nevada, New Hampshire, Pennsylvania, Georgia, Florida & North Carolina. So far, all of those states are going in the same direction they did in 2012, with North Carolina being the only state so far going for Trump. However, what should be very disturbing for the Trump campaign, and all Republicans hoping to win down-ballot races, is that the Pennsylvania & New Hampshire polls are blow-outs for Clinton. In 2012, Obama won Pennsylvania by 5.4%--polling now has Clinton with an 11% lead, well above the margin of error. Even more devastating, in New Hampshire, where Obama won in 2012 by 5.6%, Clinton is leading by a whopping 17%. We'll see if these leads hold as we approach the elections. But both of these polls are of "likely voters," one of the best polling predictors to measure.

The North Carolina lead for Trump gives him a 4% advantage. This is within the margin of error, and North Carolina was also the closest state for Romney in 2012--he won by just 2%. What should be more disturbing for the Trump campaign are the Georgia & Florida polls. The former has him tied with Clinton*, and the latter have Clinton up by 6%. Romney won Georgia with an almost 8% margin, and lost Florida by less than 1%. These numbers can change quite a bit by November, but if Trump has a reasonable chance to win the key swing states, he needs to have far better numbers than a post-convention, August 'tie in Georgia' & significantly down in Florida. Michigan, which Trump strategists claim is in play because of Trump's appeal to working class voters, is currently polling for Clinton at 9%, the same margin by which Obama beat Romney.

If there is a narrower set of "swingier swing states," it is likely to be eight: North Carolina, Florida, Virginia, Pennsylvania, New Hampshire, Iowa & Colorado, based on states from 2012 where the margins were won with less than 6%. Politico includes Michigan & Wisconsin on this list, although Obama won both with 7% or greater margins in 2012. While many of these states do not have August polling, those that do, combined with July polling, put all of these states in the same partisan hands as 2012. This, when one considers the absurdly substantial leads that Clinton has in the PA & NH polling, does not bode well for Trump. *Edit, Friday, Aug 5. Three Georgia polls have come out this week. One has Trump tied with Clinton, a second has Trump up by 4%, and a third has Clinton up by 4%. All three polls are within the margin of error, so all three represent a statistical tie.

Friday, July 15, 2016

Getting Shot Dead by Police: Analyzing Guardian Data

Two studies have been recently publicized about police shootings by race, and they appear to be contradictory. One, a study published by Ross on the online peer-reviewed network, Plos One, looks at county-level data throughout the country from 2011-2014, finding that unarmed Blacks are 3.5 times more likely than unarmed Whites to be shot dead by police than White. The second, published by Fryer at NBER, found that Blacks were no more likely than Whites to be shot dead by police, when controlling for whether the victim was armed (this could be any type of weapon). It should be noted that of these sources are 'standard' academic outlets. NBER is not peer-reviewed--they are 'working papers' published by (typically) respected economists. Plos-One is peer-reviewed and generally respected, but because it is a newer, online-only format that doesn't specialize in one specific discipline, there are extra levels of skepticism about consistent reliability.

In this present analysis, I use two data sources--first, from the Guardian's, The Counted, and second, from the Ross, Plos One article above. Both have publicly available raw data, whereas the NBER paper does not. The Guardian data is available at GitHub, and is from all of 2015 through July 15, 2016. The Ross' data is available from Google Docs, and is from 2011-2014.

I limited my analysis to just those incidents where the victim was shot dead by police, and where the victim was either unarmed, or armed with a gun (or what could be misinterpreted as a gun, such as a realistic-looking toy gun). I use the phrase "shot dead" to specifically refer to the fact that the victim was killed by a firearm. The Guardian data lists all persons "killed" by police or in police custody by any means. The Ross data only lists police "shootings", but includes victims who were shot but did not die, and victims who were shot and died. The results are in Table 1 below.

In top half of Table 1, from the column labelled "X/White:Firearm," the Guardian data shows that Blacks are 2.3 times more likely than Whites to be shot dead by police if the victim is carrying a firearm, and 4.1 times more likely if they are not carrying a firearm (Guardian data). In the bottom half of the table, the Ross data (PLOS One), shows that Blacks are 3.3 times more likely than Whites to be shot dead by police if the victim is carrying a firearm, and 4.8 times more likely if they are not carrying a firearm. Hispanics are also at some greater levels of risk in both sets of data, while Asians are far less likely to be shot dead by police in any circumstance, while native Americans are at far greater risk if they are carrying a firearm (the Ross data only looks at Black, White & Hispanic).

Both sets of data shows that Whites are shot dead by police more frequently than Blacks, and Blacks are shot dead by police more frequently than Hispanics. This holds true whether or not the victim had a firearm, although the Ross data shows that from 2011-2014, the same number of unarmed Blacks and Whites were shot dead by police. Columns 5 & 6 show the rates at which Whites, Blacks & Hispanics are shot dead by police per million of their race/ethnic group. So Blacks with firearms are shot dead by police at a rate of 5.04 per million Blacks, and Blacks without firearms are shot dead by police at a rate of 1.4 per million Blacks. The final two columns show rates of Black and Hispanic deaths by police shootings in reference to White shooting deaths by police.

Both of these data sets fail to support findings published by Fryer in NBER. His study focused only on 10 specific communities, and his core analysis focuses only on Houston. He also asks very specific questions other than "rates at which Whites vs Blacks vs Hispanics are shot dead by police." The New York Times discussion of his results is here. Criticisms of the study can be found at Vox, by Feldman, and by Simonsohn.

Table two shows the population values I used to calculate the rates per million. This data was retrieved July 15, 2016, using Census FactFinder. One of the difficulties of these types of race-ethnicity analyses, is that while the Guardian and Ross create three categories of Black, White & Hispanic, the Census has two categories for race, Black & White, and a category for Hispanic ethnicity. This means that there are actually four categories for what the Guardian and Ross list--Black Hispanic, Black not-Hispanic, White Hispanic and White non-Hispanic. The Ross data does actually provide a way to separate these out, however, it is left unclarified how race & ethnicity are determined. In this case, I calculated White using non-Hispanic White, Black as non-Hispanic Black, and Hispanic as all categories noting Hispanic ethnicity. In other words, summing White Hispanic, Black Hispanic, Asian Hispanic, etc.

Friday, July 1, 2016

Predicting the Presidential Election from Polling

The pundits are currently saying that national-level polling about the presidential election is unreliable this far out--the election is just over 4 months away. However, state-level polling can be useful. For the first part of my analysis below, I looked at the polling from the 2012 election between Obama and Romney up to July 15 to see how well their results conformed to the actual election for that state.

For my methodology, I decided to compare three polls per state. The polls had to be between May-July 15, they had to be of "likely voters," and the sample size had to be above 500. I used data from the site Real Clear Politics which has polling data going back several elections for each state. In some cases, like Virginia, there were many polls conducted between that time frame, and more than 3 that polled only "likely voters." In that case, I used the 3 polls closest to, but before, July 15. The one exception to these criteria is that I always included PPP's results as one of the 3 polls. According to a study by a Fordham political science professor, PPP had the best polling results for that election.

For the 2012 election, there were only 15 states where the difference between Obama and Romney was less than 10%--I considered only those 15 states in this analysis. As can be seen from the table, in 2012, Obama won 11 of those 15 states, and Romney won only 4. The 3rd column, labelled "PPP Poll: Date" is of the listed PPP poll, and then the results for Obama, Romney, and the difference between them. If Obama polled higher, the "Obama-Romney Difference" column is blue. If Romney polled higher, it's red. To the right of that is the second poll used, with the date the poll was completed, and their results. In the furthest right section is the 3rd poll and their results. If there are blanks, it means there were not enough polls that met my criteria to include them in the list, so some states (Nevada and Minnesota) have only the PPP poll. Two other states (Missouri and Georgia) have only 2 polls.

Using this methodology, looking at the 3 polls for each of these 15 states, if at least two polls agreed on a winner, they did in fact correctly predict the winner for that state, even as early as the May/June/July polling. For these 15 states, the pre-July 15 polling by PPP only got 2 of these states wrong: Missouri and North Carolina, and both were within the margin of error, so were statistical ties (for simplicity of presentation, I did not include margin of error in the table). Using this as a guide, I propose that this methodology is reasonably useful to predict the 2016 election.

I followed the same methodology described above to collect polling data so far from Real Clear Politics. There aren't nearly as many state-level polls this year as in 2012. This could partly be because my 2012 method allowed polls up through July 15, and many of the above polls were, in fact, from early July--I am currently writing this on July 5th, which may explain the relative lack of polls. The table below shows the results

In order to win the presidency, the candidate must reach 270 electoral votes. If we assume that Clinton will win all of the 15 states (and DC) that Obama won by more than 10%, that gives her 191 electoral votes. If we assume that Trump will win all of the 20 states that Romney won by more than 10%, that gives him 154 electoral votes. If we then look at the 2016 polling data, and give any state where at least 2 polls agree on a candidate to that candidate as a win, then so far one state is going to Trump (GA), and 4 states are going for Clinton (OH, NH, IA, and WI). That puts Clinton at 229 electoral votes, 41 short of what she needs, and Trump at 170, 100 from what he needs.

Let's assume that MO & AZ go to Trump (Obama lost those by more than 9% in 2012), and MI & MN to to Clinton (Obama won those by more than 7.5%). Clinton is at 255, while Trump is at 191. In this scenario, the only real "battleground states" left are NC, FL, VA, CO, PA & CO. If Clinton wins either PA or FL, and Trump wins all of the other states, then Clinton still wins the election. Or if Clinton wins VA+NV or VA+CO, then Clinton wins the election. As of July 5, 538 (Nate Silvers) is predicting that Clinton will win every single one of those states (MI, MN, NV, PA, CO, VA, FL & NC), with Trump winning only MO & AZ.

What is surprising for me is that in an earlier analysis I showed that since WWII, the US likes to switch its presidential parties every 8 years, with the only exceptions being the Reagan-Bush long GOP tenure, and the short Carter Democratic tenure. I also noted that those years had unique economic situations--unusually high/low GDP growth and unemployment rates--that helped to explain these departures from typical election patterns. In our present case, pundits are telling us that dramatic demographic shifts are giving Democrats an advantage this year. But regardless, as we have seen with the success of the Trump candidacy, it is dangerous to predict anything political this year.

********************

Correction: In the first version of this post, I had the incorrect values for the Georgia polls, showing that Clinton was predicted to win there. This has been fixed, and the relevant analysis corrected.

Monday, May 2, 2016

A Case for Political Momentum

Whenever I teach statistics, we usually spend a day on the "hot hands" phenomenon--the perception that, during a game, a sports player is "on fire," or "on a roll," in other words, has had a really great game up to that point, and thus, will likely continue to have similar success the rest of the game. However, the data does not support this belief (although newer research has problematized this conclusion). In fact, it has been given it's own name--the "hot hands fallacy." By way of analogy, some argue that there is no such thing as "political momentum"--that any "streak" that one sees, such as Bernie Sanders' seven wins from March 22- April 9, is simply that states already amenable to Sanders just happen to fall on consecutive dates.

While I accept the data about the hot hands fallacy, a correlational analysis of the current presidential primary race seems to indicate that a pattern has evolved on the Republican side for Trump and Kasich (not so much for Cruz). For this simple analysis, I took the percent wins for five candidates: Sanders and Clinton on the Democratic side, and Trump, Cruz and Kasich on the Republican side. In addition to the percent wins for each candidate, I also did a "margin of win" calculation for Sanders-Clinton, and Trump-Cruz. Then I ordered all of the results by date for both parties, beginning with the Iowa caucuses on February 1, to the April 26 primaries. The Democrats have had 40 such votes, while the Republicans have had 38. Then I performed a correlation on Excel, using Feb 1 as "Day 1" and April 26 as "Day 85," against each of the seven outcome measures--the percent wins for the five, or the margin of win for the two specific comparisons.

On the Democratic side, all three measures (Sanders-Clinton, Sanders % win, Clinton % win) had no time-based correlation, with an r-value of less than 0.07 in all cases. Typically we don't care about r-values less than 0.20, and we often only get excited with r-values greater than 0.50 (depending on what we're measuring, of course). Similarly, on the Republican side, the r-value for Cruz's wins over time is -0.16, implying that he is losing votes as the primaries unfold, although not by much--a statistically insignificant decrease.

However, Trump, Kasich, and the Trump-Cruz win margin shows quite a bit of increase over time. The latter shows the lowest correlation, r=0.41, implying that as time passes, Trump's win margins over Cruz are increasing. That might not make sense given that Cruz's win percents are remaining relatively the same. However, the best explanation for this is that as 14 of the 17 original GOP candidates dropped out of the race, they tended not to go for Cruz, but were split between Trump and Kasich, while Cruz got very few of those votes.

Trump has shown the greatest increase over time, r=0.64, a surprisingly strong relationship. Kasich's wins have also increased, although not by as much, with r=0.52 as measured over time. A graph of the votes makes this finding more clear. As you can see, Trump's win percents remained relatively steady from Feb 1-March 22. However, in April there were seven states who voted, and his success has tremendously improved. Cruz seemed to show a steady improvement from the beginning, through the March votes--but then sank back down to his earliest vote totals with the April votes. Finally, Kasich has been gaining percent wins steadily, and finally surpassing Cruz with the April votes. Is this "momentum"? It could certainly just be the coincidence of states amenable to Trump and Kasich. After all, the April 26 election was just states near New York. Not only is that Trump's home territory, but Cruz has said unkind things about New York, which likely cost him dearly in those states. Regardless, the correlations show a strong relationship for both Trump and Kasich, so the "momentum" claim might actually pan out for those two.

Wednesday, April 27, 2016

Primary Vote Tallies: 4/27/2016

Last night the results came in from the Northeast version of the "Super Tuesday" primary for both parties, GOP & Dem: CT, DE, MD, PA & RI. Trump swept all states with percents in the 50s & 60s, while Clinton took four states. On one hand, it has been claimed that turnout is greater than in other recent primaries, indicating a surge in political interest this year, but on the other hand, 538 claims that turnout in the primary is unrelated to turnout in the general election. From the candidate's perspective, Trump has claimed that he has "millions more" votes than Cruz.

There are numerous ways to look at each of these claims. In general, each of the claims is true, and as of the most recent votes (4/26/16), they remain true. However, digging into the data can produce interesting results--I have provided two data table below of all of the state votes so far: the first are sum totals by candidate, and the second is all of the data at the state level. Total, Clinton has received the most votes of any individual candidate, and she can make Trump's claim, that she has "millions more" votes than Trump. She also has "millions more" votes than Cruz and Kasich combined. Sanders has more votes than Cruz or Kasich separately, but fewer votes than Trump. Clinton and Sanders combined have received more votes than Trump, Cruz and Kasich combined.

Clinton12,173,896
Trump9,972,683
Sanders8,980,077
Cruz6,777,746
Kasich3,641,272
Cruz+Kasich10,419,018
Clinton+ Sanders21,153,973
Trump+Cruz+Kasich20,391,701

Then table below is the data I used for this analysis. There are some important caveats in the totals I presented above. First, there are states where raw citizen vote numbers for one or both parties simply aren't published. For example, Alaska, Wyoming and Colorado provide only delegate convention votes for either the Dem or GOP side, or both. I have excluded those states from the table. Second, some states have only had a primary/caucus for one of the parties, such as Kentucky, Nebraska and Washington. I have excluded those states from the count as well. Third, I have intentionally excluded counts for any other delegates, like O'Malley on the Democrat size, or Rubio, Carson, etc, on the Republican side. I make no claims for the total GOP or Dem totals if you factored in those votes, or the votes from the states I excluded.

StateBernie SandersHillary ClintonDonald TrumpTed CruzJohn Kasich
Alabama7639930992837173518060837970
Arizona16340023569724991613214753040
Arkansas6486814458013314412387315098
Connecticut36659559501225192477960447
Delaware152895169763424721111014225
Florida56660310974001077221403640159412
Georgia21433254300850170730510972303
Hawaii2353010125680550631566
Idaho1864050656247810094216517
Illinois9820171017006556916434038282874
Iowa852558574545427516663474
Kansas264501259317062352077795
Louisiana7224022161512481811394919355
Maine22311232607085502270
Maryland28127553324723662382038100089
Massachussets58671660378431131360473113783
Michigan595222576795483751330015321655
Minnesota1181357351024018326846488
Mississippi3634818244719175514706535817
Missouri30907131060238209338036792533
Nevada5678631634531160792709
New Hampshire151584952521004063318944909
New York7634691054083524932126151217904
North Carolina460316616383458151418740144299
Ohio513549679266727585267592956762
Oklahoma17405413933813014115794116515
Pennsylvania719911918649892702340201304793
Rhode Island667205249339059639314929
South Carolina9597727151423985116479056206
Tennessee12033324530433270221115945243
Texas4755619350807576181239370120257
Utah61333156662486412256729773
Vermont1158631833519968592918543
Virginia27550750335835596017319396519
Wisconsin567936432767386370531129155200

Saturday, April 9, 2016

Regressing Kasich

I have been posting regression models that fit/predict the presidential primary races by state. Most recently, on the GOP side, four models that use between 3-5 variables each, correctly fit almost all of the states that had voted as of last week, and on the Democratic side, four models that use between 4-5 variables each, also correctly fit almost all of the states that had voted up to, but not including Wisconsin (all of which correctly predicted Sanders' win there). I have so far ignored Kasich, since it was clear early on that he would not gain enough state-level votes to get the presidential nomination on the first ballot. However, since the algorithm I developed makes it easy to plug in the other candidates, I decided to put Kasich through the models.

There is an important difference between all of the other models on both sides that I have produced so far, and the predictions to the right for Kasich. In prior models, I have used the dependent variable of the leading candidate minus the second candidate--thus, Clinton-Sanders, and Trump-Cruz. The resulting fits/predictions are of the difference between those two candidates, not a fit/prediction of the actual percent of win for the candidate. For Kasich, I have created the models based solely on his percent wins for each state. Using the same base of 3,000 variables, and preferencing models that have good statistical values, such as low residuals and BIC, and high adjusted r-squared, as well as a diversity of the "type" of variable used (jobs vs demographics, etc), to the right you will find the fit/predictions for all 50 states, and below you can find the statistical data about each model. All models have significance of p<.001, and all coefficients have significance of p<.01 (most are p<.001). Similar to the prior models, I used about 3,000 variables as the starting point, and while there were a number of very good models that were produced, I present one 2-variable, one 3-variable, and one 4-variable model. I did not test any higher order models.

There are some interesting, and unlikely predictions in some of the models. For example, Kasich2 & Kasich3 (the second and third models) both predict that Kasich will get 50% in New Jersey--a highly unlikely eventuality. Similarly, both models predict negative teens in North Dakota. Clearly, he cannot get negative votes, however, those models are very pessimistic at his success there. Both models provide fairly similar predictions, despite the fact that there is only one common variable between the two models--the percent of women in wholesale drug and chemical business in those states.

One of the unique features of the Kasich models, compared to both the Clinton-Sanders & the Trump-Cruz models, are that in the best Kasich models, I repeatedly found high ranking variables that described women in the workplace. For the previous models, the dominant jobs variables always described men in the workplace. The only male variable in the Kasich models is the broadest of the jobs measures I used, the change in the number of men's jobs from 2000-2013. The women's variables were specific to the last few years, and not a change in the jobs over time. For men, a decrease in the number of jobs, as shown in Kasich1, indicates that Kasich will do better in that state. In Kasich 2 & 3, more women in specific jobs compared to men, like wholesale drugs and chemicals, tends to signal better performance for Kasich.

There were several demographic variables in the high ranking models. The most common were those that designated a change in population and the percent of White Evangelicals. For population change, the second two models indicate that Kasich does better in states with decreasing populations, either from general population decline, or from out-migration. For religion, specifically the measure of White Evangelicals, Kasich does better in states with fewer of them. Economically, Kasich does better in states with higher costs of living. Interestingly, he does better in states where Black families have lower incomes. No other family income measure had a significant predictive utility for the Kasich models.

Thursday, April 7, 2016

Republican Presidential Primary Models: April

Last week I published new models for the Democratic presidential nomination race--here are the new Republican models, updated to include Wisconsin and a broader set of variables. Like the new Democratic models, I de-emphasized theory-building, and generated models that have the best fit of the states which have voted so far, specifically, by including models that use very specific types of jobs variables, like "men in agriculture, forestry and mining (2009-14)," & "change in the number of men in mining jobs (2000-13)." While one can plausibly build a theoretical case for why jobs data is related to the Republican race, it is far more difficult to explain why these specific jobs built statistically significant regression models, while related jobs variables did not. However, even including these jobs variables into the analysis, the best models were largely similar to the last set of models from March 23.

The first table, to the right, shows the state-level predictions/fits for the four models. The first column is the state, and the 2nd column shows the votes that have taken place so far. This is a simple subtraction of Trump-Cruz. It does not account for other contenders, such as votes that Rubio or Kasich have received. A positive number means that Trump beat Cruz by this margin, while a negative number means that Cruz beat Trump by this margin. The numbers highlighted in pink in the next 4 columns are the states this model incorrectly fits. So, for example, Rep1 got Louisiana and Maine wrong--it predicted that Maine would go for Trump, when it actually went for Cruz. Similarly, Rep4 gets 1 state wrong--also Maine. Rep2 and Rep3 correctly fits all 32 states that have voted so far in the Republican race. At the bottom of the page, the next table, lists the specific variables used in each model, and statistical information about each model.

The first model, Rep1, is the most efficient model--it uses only 3 variables, and only gets 2 states wrong, as mentioned above. It uses the percent of young women in the state, employment, and men in agriculture, forestry and mining. As with the previous models, employment & unemployment are important predictors of the Trump-Cruz race. In the prior models, I used unemployment, and the beta-coefficient was positive--meaning that in states where unemployment was high, Trump tended to beat Cruz, and vice versa. In the new models, I used employment, and as predicted, this coefficient is negative, describing that in states where employment is low, Trump does well, but in states with high employment, Cruz does better. This can be seen in specific jobs numbers found in each model. In Rep1, as the number of men in agriculture, forestry and mining (AFM) jobs goes down, Trump does better. In Rep2, as the number of men in mining jobs declines, Trump does better. Not all jobs had this pattern, or showed this level of statistical significance. The effects for women's employment was also not nearly as statistically significant in the Republican race, compared to the effects of men's employment. In Rep 1, the beta-coefficient shows that the AFM jobs variables is the strongest predictor, while the general employment variable is about half that. A test of the VIF (variance inflation factor) showed that while these two variables describe similar things, they do not influence each other in this model (vif<2 for both variables).

All of the models have an economic variable, in addition to the jobs variables. In Rep1 & Rep4, the economic variable is employment. In Rep2 & Rep3 it is family income. The results are consistent with the employment variable--i.e., in Rep1 & Rep4, when employment goes down, Trump does better, and in Rep2 & Rep3, when family income goes down, Trump does better. In that sense, all of the jobs and economic variables show a pleasing consistency--the worse the economy and jobs are, the better Trump does in that state.

Rep2 & Rep 3 are the most accurate models, in terms of correctly fitting all 32 states, and having the lowest residuals. But that comes at the cost of having to use 5 variables. In this case, both use two "political" variables, one "jobs" variable, a "cultural/demographic" variable, and an economic variable. Both models use a "tea party" measure, the strength of the tea party in Congress (the House), in 2011-12. In those states where the tea party did better, Trump does better. So while Cruz had a dominant history with the tea party, it could indicate that in states with stronger establishment voters, they are willing to deal with Cruz in order to avoid Trump.

Rep2 and Rep3 both use a second political variable--Rep2 uses the difference between the Obama and Clinton primary race in 2008, and Rep3 uses the percent of Democrats in the state-level senate (2014). The latter is positive-meaning that the more Democrats in your state senate, the better Trump does. The former represents a simple subtraction of Clinton-Obama, so a positive value indicates a win for Clinton. This beta-coefficient in Rep2 is positive, indicating that in states where Clinton did well in the 2008 primary, Trump does well in those states. Rep4 also has a political variable, results of the Republican vs Democrat presidential contests in 2000 & 2004, an average of a simple subtraction: Republican % - Democrat % in that state, meaning that a positive value indicates a Republican win by that margin over the Democrat. This beta-coefficient is negative, meaning that stronger Democrat wins in that state predicts stronger Trump wins. These latter two variables would seem to indicate that where you have a stronger Republican party, measured by stronger Republican margins in state and federal elections, Cruz does better. Perhaps this is indicative of Democrats willing to cross over to Trump, but not Cruz, and Independents, who might vote Republican or Democrats, are going voting for Trump (or are unable to vote at all in closed primary states, where they are required to register for a specific party).

Rep2, Rep3, and Rep4 also have "cultural/demographic" variables. Rep2 has a measure of race, the percent of the population that is Black. This beta-coefficient is positive, meaning that states with more African-Americans give Trump higher wins. Rep3 has a measure of a "Southern Culture Index" that I created--it also is positive, indicating that states with more "Southern Culture" tend to vote for Trump. This index is a combination of death rates, teen birth rates, slave population in 1860, and percent of the population that is White Evangelicals. Rep4 has a unique variable, provided by data from the British source, The Guardian, that counts how many citizens were killed by law enforcement in that state. This beta-coefficient is also positive, indicating that the more citizens killed by cops in your state, Trump does better. Predictably, this number is higher in Southern states, consistent with the prior two demographic/cultural measures.

There are very few "prediction" differences between these models and the models from March 23. Most significantly, from the April 5th Wisconsin vote, all four of the newest models show a Cruz win, while of the prior models, two of three showed a Cruz win. The "correct" model (M1R) is actually the same as the second model above, Rep2, and the beta-coefficients are very similar--this is expected, since the only difference in the new analysis is the inclusion of Wisconsin. However, most states show the same wins for both candidates. For example, all models, new and old, show strong wins for Trump in California, Connecticut, and New York, while giving Cruz wins in Montana and South Dakota. Some states have mixed predictions in the models, like Nebraska and New Mexico, so its anybody's guess there. Most models have Indiana going for Cruz (barely).

Saturday, April 2, 2016

More Primary Prediction Models--2016

For my third round of creating primary prediction models for the presidential nomination, I focused just on the Democratic nomination between Clinton and Sanders. Here, I publish four new models, two of which correctly fit all 32 of the Democratic votes, and two that have only missed one vote.

I have not recalculated Republican-side models. Previously, I generated two models that had, as of March 23, correctly fit all states that had voted to that point. Aside from that, it looks like no matter what happens with the primary results, the GOP convention will become an open/brokered process. In that case, regression models about the primaries would be pointless, so I did not invest the time to recalculate them.

My last Democratic models, created just prior to the March 26 caucuses where Sanders swept Hawaii, Washington an Alaska in landslides, used 3 & 4 variables to correctly predict fit almost all of the states which had voted prior to those caucuses, and in all cases except one, correctly predicted these three wins for Sanders (one of the three models predicted a large Clinton win in Hawaii). The first of those three models, M1D, use unemployment (Dec 2015), no religious affiliation, out of state migration, and an average of the 2008-2012 presidential election votes, and so far has only 1 error, Iowa, out of the 32 states that have so far voted. The second model, MD2, so far has only 2 errors, Iowa & Oklahoma.

In these new models I do two things. First, I updated the algorithm to include the three states that have voted since I generated my last models. Second, I used the "numerically best" models, regardless of their application to theory. For the previous models I published, I ruled out those models that may have looked good on paper, but used obscure variables, like "number of men who worked in sports, hobby and toy stores in 2013," "women who work in the pharmaceutical retail stores," or "men who work in tobacco stores." While those are, to some degree, economic variables, and I was giving preference to economic variables, it is hard to make a broader theoretical cased based on these variables, since you would have to explain why these three specific job variables did a good job fitting the voting patterns, and the other 800 jobs variables had far less success. However, for these models, I throw theory to the wind, and include the obscure jobs variables. I filtered out those models that used more than two jobs variables.

There are some differences in predictions between these models, and the models from March 23. For example, in the previous models, Delaware was firmly in the Clinton camp, and both Rhode Island and West Virginia had two models putting them firmly in the Sanders camp. However, these new models put Delaware firmly for Sanders, and now the latter two are firmly showing for Clinton. There are several other states, like Maryland, New Jersey, New Mexico, South Dakota, and Wisconsin, where the previous models were contradictory, and solidly for either Sanders or Clinton now, or where they were previously showing a trend for one, but now are less clear. Given that the more recent models include more data, I would tend to support the findings of the newer models. However, MD1 from the first set of models still only has one incorrect state, and MD2 still only has two incorrect states.

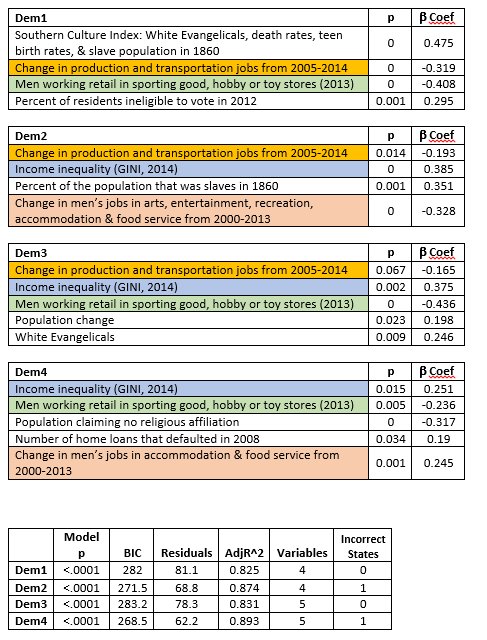
One of the most common variables that appeared in the best models, is the income inequality variable, GINI, for 2014. As this value increases (approaches 1), it signifies more inequality, and as it decreases (approaches 0), it signifies more equality. In all of these models, the Beta coefficient is positive, meaning that as the value of this variable increases, the value of the dependent variable also increases. The dependent variable in this case is the difference between the Clinton and Sanders vote, as a subtraction (Clinton-Sanders), so is positive when Clinton wins, and negative when Sanders wins. What that implies is that in the states where you have greater levels of inequality, they are voting in larger numbers for Clinton. One might propose that poverty or education might be at work, rather than inequality, as such. However, several measures for poverty and education were included in the algorithm, and even accounting for those, income inequality is by far the more powerful predictor.

In a prior effort to find patterns in the data, I attempted to control for "cultural" factors, specifically, "Southern Culture," since there seemed to be early differences between Sanders vs Clinton wins based on the latter's southern victories. This Southern Culture Index did not make any of the previous best models. However, it was useful in one of the current models, Dem 1. As was previously shown, this index consists of four variables: % of White Evangelicals, death rates, teen birth rates, and slave population in 1860. A higher value means that state has stronger characteristics of "southern culture." Since the Southern Culture Index is positive in the Dem 1 model, it describes that the "more southern culture" a state has, the more likely it is to vote for Clinton. This result is fairly obvious just looking at a map of the Democratic contest so far. However, in the Dem1 model, what the results show is that it is the strongest of the four predictors.

In Dem2, the slave population variable is present by itself, and unsurprisingly given the results of the Southern Culture Index, as the slave population of 1860 increases, those states vote more strongly for Clinton. Similarly, in Dem 3, White Evangelicals appears as its own predictor, and like these other two, as they increase, so does support for Clinton. Conversely, hose that claim no religious affiliation appears in Dem4, and as expected, it is negative, showing that as this population is larger, that state votes more strongly for Sanders.

There are three jobs variables that made it into the final models: 1) "Change in production and transportation jobs from 2005-2014," 2) "Change in men's jobs in arts, entertainment, recreation, accommodation, & food service from 2000-2013,", and 3) men working retail in sporting goods, hobby, or toy stores in 2013." The most conservative way to interpret these results, when put into the context of the large number of jobs variables that were used to test models, is that the patterns in these jobs were just coincidentally, mathematically similar to the pattern of voting in the first 32 states which have voted so far this year. That may be the most one can say. Even if one were to assume that these results aren't simply a coincidence, one would still have to come up with a rationale for why, for example, when it comes to arts & food service jobs, the important factor was the change from 2000-2013, as opposed to 2005-2014. Similarly, one would have to explain why the production & transportation jobs change was important from 2005-2014, but not from 2000-2013. And why, of all of the possible job types, why these--why arts & food service, or why transportation & production? Perhaps there is a good explanation for these patterns, but I do not have one. My best guess is that it is coincidence, until other evidence is produced--for example, a good theory is presented, or the models correctly predict the rest of the state-level votes.

The jobs variables are mostly negative, meaning that as this value goes down, the dependent variable goes up, and vice versa. As jobs are lost over time, these variables become more negative, or as jobs increase over time, these variables become more positive. Since these values are mostly negative, presuming the results aren't simply a coincidence, it shows that in these states, as jobs in these specific fields are lost, they vote more strongly for Clinton. As jobs in these specific fields are gained, they vote more strongly for Sanders. One exception, is between Dem2 and Dem4. In Dem2, this is the broadest jobs variable in this sector--it includes arts, entertainment, recreation, accommodation, and food, and as these jobs are lost, that state votes more strongly for Clinton. However, in Dem4, this is just food and accommodation jobs. This variable is positive, meaning that as these jobs are lost, these states tend to vote more strongly for Sanders.

As before, I gave preference to those models that had the smallest residuals, the largest adjusted R-square, the lowest model p-values and variable p-values, the lowest BIC, and correctly fit the most states. All four models presented here have an adjusted R-square above 82%, and correctly predict either 31 or all 32 of the states that have voted as of April 2. All have model p-values less than 0.0001, and all variables have variance inflation factors less than 2.5. All individual variables have p<0.05, except for Dem 3, where one variable has p<0.07.

Saturday, March 26, 2016

Brain Drain--Indiana is at the Bottom of the Barrel

According to recently released 2014 Census data, Indiana ranks at the very bottom of states, 50th, for "Brain Drain," a not-so-fancy social science term to describe the migration of people with advanced degrees out of one place and into another. Brain drain is typically related to that country or state having lower wages or professional employment opportunities and poorer quality of life. There are various ways of measuring brain drain, but the most typical measures involve simply counting the number of people with college degrees who are leaving your area compared to those who are moving into your area. For example, in the table to the right, the column "BA+Grad" is a subtraction of the number of people with bachelor's and graduate degrees who have moved into your state minus the number who have moved out of your state. A positive value means more college-educated people have moved into your state than have left, while a negative member means that state had a net loss of college educated people.

In the table I have included three additional columns. The 4th column, "BA+Grad," is the simple calculation described above. The 5th column, "No HS/Only HS," is a similar calculation, but measures the migration of people with only a high school education (no college at all), or with less than a high school education. A positive value means that poorly educated people are moving into that state at higher rates than they are moving out, while a negative measure means that state has a net loss of residents, but they are very poorly educated residents. The 3rd column, "Coll/ NoColl Migration, simply describes the sign of these two types of migration: +/+ indicates that both the highly educated and poorly educated are moving into your state, while -/- indicates that both groups are moving out of your state.

The first column, "Brain Drain Rank," ranks this migration process based on two measures. The primary ranking is the positive vs negative flows. If more educated people are moving into a state than leaving it (+/+), it has a higher rank. If more poorly educated people are moving into a state than leaving (-/-), it has a lower rank. The lowest rank in this list is for states who not only have negative migration of highly educated people, but have positive migration of poorly educated people--meaning that people with college degrees are leaving the state, while people with only a high school degree or less are coming into that state. Thus, a state could have a net gain of people moving into a state, but that gain comes entirely from poorly educated people.

Data indicates that there is a strong relationship between education and employment. People with college degrees have a far higher likelihood of finding jobs compared to people who only have a high school diploma or less. Further, those jobs tend to pay far more. Thus, an net in-flow into a state of people with only a high-school degree (or less), means that state could face greater demands on its social services budgets due to higher rates of unemployment of its residents, while a net out-flow of people with college degrees can mean there are fewer resources to increase the tax base and social service providers. On the one hand, it is of course problematic for a state to have net losses of a population--"dying states," as such--for example, Alabama, Kansas and Kentucky, who lost both the highly educated and the poorly educated in 2014. On the other hand, it becomes an even greater problem for a state's economy when the highly educated are leaving, but the poorly educated are moving in.

Indiana ranks the worst in this combined measure--states who lost people with college degrees, but gained people with only a high school education or less. Indiana had the highest rate of loss of college graduates. Six states had higher rates of loss of college graduates--New Jersey, Illinois, South Dakota, New York, Wyoming, and Alaska. However, these states lost both the highly educated and the poorly educated, with Alaska hemorrhaging both types of people. Fourteen states (including Indiana) had a pattern similar to Indiana, where they lost the college-educated, but gained the poorly educated--Indiana had the highest rates of loss of college graduates, and the 3rd highest rate of increase in poorly educated migrants, after North Dakota and Wisconsin.