Tuesday, December 24, 2013

Education Spending Disparities--international Comparison

I have heard several commentators lamenting that the U.S. spends more per student on education than any other industrialized country, but we are mediocre on international comparisons of math, reading and science. They base this claim on two sets of OECD data--spending per student, and PISA measures. A quick glance at the graphs often reproduced to support the education spending claims would seem to clearly support this assertion (see Graph 1):

The claim of "more spending per student than any other country" is often followed by the complaint about teacher's unions forcing us to pay more than any other country for teacher salaries, yet preventing us from firing bad teachers. While the former claim is partially true, the latter is not. Leaving that debate for another discussion, it is important to understand the spending data. First, Graph 1 shows "all" education spending, which includes pre-primary all the way through tertiary spending, including vocational spending. It also includes all funding sources--local government through federal, and includes private funding (spending is converted from national currency to PPP by GDP for interstate comparison).

However, separating tertiary spending from primary/secondary spending produces a slightly different picture (note also that this data is just from a one-year snapshot of 2010).

No longer the biggest spender in these categories, we are clearly in the top spending cluster, although all of the top 8-12 countries are relatively close to each other (except the top-spending country, Luxembourg, whose GDP/capita is just less than twice that of the US, by far the largest of the OECD countries). Looking at tertiary education, i.e., university and college spending (excludes vocational training), the comparison looks quite a bit different.

What we can now see, is that while our national conversation about education is typically centered around primary and secondary failings, linked to high levels of comparative spending, our actual spending compared to other countries is greatest for tertiary education. I will come back to the issue of primary/secondary school funding, to suggest a clarification for how we can still be at the top of the cluster of spenders, but still be producing poor results. As for tertiary spending--where is all that money going? While an excellent question, a number of recent analyses have indicated that US spending on college sports (and here, and here), as well as administration/bureaucratic costs (and here) far outpaces other countries, and has little benefit to student learning, which is arguably the main reason for the existence of the university. Note that the skyrocketing US tuition is not going to most faculty, especially the adjunct faculty who comprise over 50% of teachers in most state schools--many of those part-time faculty are on food stamps and receive no benefits or job security.

The above chart clearly shows that we in the US are spending far more than any other country on tertiary education--but why is that? Are there more of us going to college? Are we going to college longer? It's definitely not the former. In fact, we have one of the lowest college-participation rates of all of the OECD countries.

So we are spending far more than any other country on tertiary education, but sending almost the lowest proportion to tertiary education. The problem would seem to be the costs themselves. Indeed, most OECD countries provide free, or almost free, tertiary education: France, Denmark, Sweden, Iceland, Finland, Norway, Belgium, Spain, Italy, Austria, Poland, Turkey, Mexico, and Slovenia. The graph below separates the tertiary institutions into two categories--public and private--with average cost per student for each (countries with no bar data either are completely free, as listed above, have no private colleges, or did not supply data). As can be seen, the cost of a U.S. education, especially for private colleges, far supersedes any other OECD country.

Finally, getting back to the question of primary/secondary funding, if we are spending near the top of the cluster, there is the persistent issue that our students are performing at a mediocre level compared to other countries. Intuitively, this must be an issue of how the money is being spent. But perhaps a better question is "where" the money is being spent, speaking geographically. A recent analysis showed that, unlike almost every other OECD country, our money is being spent where our wealthiest students reside, while we strip funding for our poorest students. The OECD data shown below supports this proposal, to the extent that we have created an educational system whereby the majority of funding comes from local sources, predominantly property taxes, whereas other countries have far greater input from federal sources for more equitable distribution of national resources. Unlike the graph above for primary/secondary spending, which was only for 2010, the graph below is an average of 2006-2010, to generate a broader representation of spending. Here it is evident that we are close to Luxembourg for spending, far above the other countries. However, it is also clear that we shift the majority of our funding to local sources, with relatively little federal funding.

One might notice that several countries with high PISA scores also have a large percent of their education budget from local sources, such as Norway, Denmark, Finland, Iceland, Canada and the UK. The critical difference is that in all of these cases, their levels of inequality (GINI) are far lower than that of the US. So while all countries have areas that are poorer, and some are wealthier, in the US there is tremendous geographic inequality, large islands of poverty, and large islands of wealth. In areas of poverty, where education is funded by property taxes, there is very little money coming into schools, and relatively little federal money to make up the difference. On the contrary, areas of wealth have the ability to collect sufficient funding for a wide variety of educational supplements, infrastructure/development investment, and recruiting of the best teachers. In countries with low-GINI there are far higher levels of equality throughout the population and the geography, with far higher spending on social safety net systems designed to generate equality of opportunity and access to resources. I will leave this for another time to demonstrate myself--in the meantime, others have already analyzed the OECD and US data, arriving at the same conclusion.

Sunday, December 8, 2013

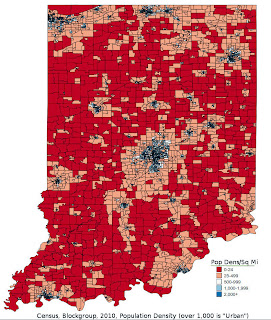
Indiana State Legislative Districts vs Census Population Density

In addition to publishing population data, the U.S. Census also publishes geographic electronic files showing the shape of various types of government boundaries, from city to state to federal. Between the GIS Tiger files repository that holds the shapefiles of boundaries such as state legislative districts, and the main census data repository, there is a wealth of information that can be gathered and mapped. An open-source (and free) software, Quantum GIS, is available to import the Tiger shapefiles, and combine those with the Census data. Below I have posted some of the possible mappings that are available from these resources.

The first two images represent a "block-group" population density mapping of Indiana. The first of these images is an actual population density, derived directly from Census. While there is no variable for "population density," it can be readily calculated using "total population" divided by "land area." Population comes from the factfinder2 Census site linked above, and land area is embedded in the Tiger shapefile. There are various levels of measurement available from the Census, ranging from the entire US-level, all the way down to the block-level. In this case I have used the 2nd smallest unit available, the "block group" level, which is one step smaller than the "census tract" level. The calculated value can be transferred to the original Tiger block-group level shapefile and mapped through QGis. The Census definition of an urban space is one with 1,000 or more people per square mile. The Tiger shapefile gives the land area in square meters, so in order to get a square miles value, you must include a conversion factor. There are two primary sources in the Census for population--the annual ACS sample, and the decennial Census. The latter includes the entire population, while the former contains just a few individuals from each locality. The decennial Census allows more accurate reporting, and far smaller localities to be used. For this data I used the decennial Census.

The second image in this set is urban density, also derived solely from Census data. One of the values you can choose from the factfinder2 site, in addition to "population," is "urban" vs "rural." Within this set of information you can find 3 distinct values, in addition to the total population of the area. The first is "urbanized area" population, which is the number of people who live in regions with 50,000 or more people. The second is "urban cluster" population, with between 2,500-50,000 people. The third is "rural" population, with less than 2,500 people. The Census pre-defines these values based on the localization of the population density. This particular map is by block-group, and indicates the percent of people in each block group that occupy an "urbanized area." This is different from population density, in that the latter represents the total population/land area. Urban percent represents the percent of the population of an mapped feature (in this case a block-group) whose total incorporated area represents 50,000 or more people.

The final four images represent the Indiana state legislative districts, as highlighted by both population density and urban percent. The first two of these images is the lower house districts, while the last two are upper house districts. There are 100 lower house seats, and are analogous to the federal House of Representatives, while there are 50 upper house districts, analogous to the federal Senate. The Census Tiger shapefiles for these districts are drawn from the 2013 legislative maps. The population for the districts come directly from the Indiana web site, but the population density and urban percent had to be calculated by QGis, since the Census has not yet published either of these values for state legislative districts. I calculated these values by downloading the block-group-level population and urban data from factfinder2, and block-group-level shapefiles from Tiger, in addition to the state legislative shapefiles. In QGis there is a vector feature, "join attributes by location," which allows the user to spatially integrate various features. In this case, I used the spatial features of the state legislative districts, both upper and lower, respectively, as the digital shape targets, and "joined" to those shapes the population data in the block-group-level shapes from the second shapefile. Since there are many block-groups per legislative district, a join by "sum" allowed for a total population could be obtained for each of the districts.

The population density values were calculated directly from the land area given in the shapefiles for the legislative districts, and the population from the Indiana data for each legislative district. For this, QGis was not needed for calculations, just for mapping. In this case, as above, I used land area divided by total population, with the inclusion of the square meter to square miles conversion factor. However, for urban percent, I had to use the "join attributes by location" feature. After the join summed the values, the result was, for each legislative district, a sum of the population whom the census determined lived in an "urbanized area," as well as the total population for each district. The map colors thus represent the percent of people living in each district whom the Census has determined lives in an incorporated area of more than 50,000 people. This process sometimes has spatial difficulties--for example, block groups can cross legislative lines, and thus QGIS may produce unpredictable results in those instances. The summed populations did not match the populations given by the State of Indiana for each district. However, even if the population as such wasn't always accurate, the ratio of urban population to total population should be reasonably consistent with the spatial features. To test this, I compared the resulting urban percent values with the population density, which produced a correlation of r=0.78. I also did two separate comparisons, one using the census-tract level, and again with the block-group-level and the results were almost identical. For a finer comparison, a block-level measurement could be used, but that requires downloading separate files for each county, as opposed to one file for the entire state, and then integrating all of those county-level files back into one huge state file. For the purposes of this demonstration, the block-group-level files should be sufficient.

Wednesday, November 27, 2013

Ethnic Violence in the Balkans and the Caucasus

For a class I'm teaching this semester, we will be talking about the inter-ethnic violence in the post-Yugoslavia countries, and the mountainous region between Russia and Turkey/Iran. Playing with Quantum Gis and a Harvard dataset of ethnic group (GREG)s, I mapped the groups onto a current map, along side a table with post-1989 civil/political-related deaths from the Uppsala dataset of global armed conflict (PRIO). I will be using the figures below in my lecture.

One of the interesting features of this region since the fall of the Soviet Union, is the radically different paths taken by the satellite states. Consider that most of the post-communist countries had relatively peaceful transitions out of Communism, from Poland, to Hungary, to Czechoslavakia, to Germany. Even countries further east, like the Ukraine's Orange Revolution was relatively violence-free, at least on the side of the protesters (those wanting a change in government and political process). Building on a generation of non-violent protests, from Ghandi to Martin Luther King Jr, and many others during this period, non-violence proved a radical weapon in transforming dictatorial governments.

On the other hand, countries with radically ethnically-diverse populations had transitions that brought far more loss of life. As can be seen from the tables, many were killed, for example, as Serbia tried to keep Yugoslavia together, opposing first Slovenia's independence, then Croatia, then Bosnia-Herzogovina, and most recently, Kosovo. From the ethnicity map, it is clear that most of the Kosovars are Albanian. When Kosovo rebelled against Serbia for liberation, Serbia led brutal attacks on the population. Macedonia, to the south, opened its borders in 1991, and let Kosovars come in, dramatically increasing the Albanian-speaking population in northern Macedonia. From the table, one can see a subsequent fatalities marker for Macedonia in 2001, when the Albanian/Kosovar refugees who stayed in Macedonia, later rebelled against Macedonia. Just this month (Nov, 2013), Kosovo held the first national election for local offices, after having entered into an EU-brokered agreement with Serbia, that the northern part of Kosovo would be released from Serbian control back to Kosovo. The continued Kosovo-Serbia conflict is one of the primary factors preventing them from being accepted into the European Union, and the agreement helps pave the way through that impediment.

Turning to the Caucasus, there are at least 40 recognized, distinct languages in the region, and the ethnic divisions map shows the compact space with tremendous diversity. The mountains run from north-west to south-east, dividing the country into north and south. At the intersection of three great empires, Ottoman, Persian, and Russian, they have been at the cross-roads of these rich cultures, as well as the intersection of centuries of battle. While the low-land cultures at the foot of the mountains tend to assimilate reasonably well into the conquering empires, the highland cultures in the mountains, such as the Chechens, Dagestanians, and Ossetians, have posed great difficulties any invader. In the last WWII period (1944), Stalin deported all of the north-Caucasus people to the Gulags, many dying on the way, in what was later recognized as a genocide by the European Parliament. As can be seen in the Caucasus violence table, Chechnya has been rife with violence over the last 20 years.

Thursday, November 14, 2013

RTMP downloading

I am currently teaching a class on "Modernizing Europe" and like to incorporate as much documentary video as possible to help draw in the students who are visual learners, and who have been socialized into a media-oriented culture. Unfortunately, several documentaries produced by news organizations are not available other than by directly viewing them online (they aren't on sale), which isn't always feasible in a classroom setting, where sometimes internet glitches occur, such as inability to connect to internet, or an unexpectedly slow connection for video. So I like to have a personal copy of such videos to show in class on a jump drive in case of such an emergency. Often videos are available in torrent form for sharing (Pirate Bay sharing site, qbittorrent software, etc.), but sometimes they aren't, which means finding a way to directly download the videos from the host site, for example, PBS.

I used to have occasional success using browser extensions, especially when the video was directly served as an flv or mp4 file, but none of those seem to work any longer as the video is often on a separate server in an RMTP process. The most recent solution I have found is reasonably complicated, so I'm writing this to remind myself of the process. The software rtmpdump works to extract the video. For my system (Windows 8, using Mozilla) I had to download the main file, rtmpdump, and then a second file from NirSoft, rtmpdumphelper. From the rtmpdump download I had to start "rtmpsuck.exe," then from the second download I started "rtmpdumphelper.exe." I then opened my browser, navigated to the page with the video, and started the file. The rtmpsuck program recognizes that an rtmp file has been accessed and is playing, then identifies the source. Rtmpdumphelper imports that information and begins downloading it.

Saturday, October 26, 2013

Occupy + Tea Party map

As I continue to play around with the Occupy and Tea Party mapping, here is my first map that joins both movements into one map. The borders are federal congressional House districts as of 2013, and the colors represent how "Tea Party" the candidates are, based on 3 measures: their activism in opposing the Affordable Care Act, their willingness to shut down the government to oppose the ACA, and the representative's FreedomWorks rating (a Tea Party donor group). The redder the district, the more Tea Party candidate activism, while the bluer the district the less the Tea Party candidate activism. The Occupy Protests are marked by dots for each city where there was a registered protest, based on 3 different reporting sites. The size and color of the dot represents the size of the protest. Unlike the previous maps, where I had mapped the OWS protests into congressional districts, I have now used NationalAtlas.gov data to map each individual city. Unlike the Occupy groups, which centralized reporting for protests, Tea Party did no such centralized reporting, plus they had large financial donors supporting busing campaigns to centralized locations. This means that Tea Party "protests" may not be tend to be localized to a city the way that Occupy was, and since the Tea Party's goals were specifically legislative, while OWS goals were cultural, it makes sense to map Tea Party to legislative districts, while keeping Occupy localized.

Thursday, October 24, 2013

Occupy Wall Street Mapping, and Others

In the process of gathering data about the Tea Party, I also collected data about Occupy Wall Street protests in the U.S. For the OWS map below, I used 3 sources, one event per city, and mapped the events by congressional district (2012). The first OWS map is by the number of cities in each district with a registered protest. The second OWS map is by the largest estimated number of protesters per district (all city protests per district summed). Following these two OWS maps, I have several other maps from data that have been collecting, all of which is mapped at the congressional district level. Map 3 is a Partisan Voter Index, similar to that found in the Cook Report, but calculated by a non-Cook-related individual, estimating voter party preference for that district based on the last 2 major elections. Map 4 is Tea Party related, in that it is shows the FreedomWorks rating for each district representative as of 2013 (FreedomWorks is a major Tea Party donor). Finally, map 5 is a political rating score from a researcher at Stanford, Bonica, based on candidate criteria (the CF score).

The city-mapped data by congressional district is estimated. In other words, I could not find a good database that lists U.S. cities by congressional district, so I situated listed cities into districts by a brief Google search. If any of you discovers an error (and there may be several), please let me know.

Occupy Wall Street Sources:

  1. http://en.wikipedia.org/wiki/List_of_Occupy_movement_protest_locations_in_the_United_States

  2. http://www.theguardian.com/news/datablog/2011/oct/17/occupy-protests-world-list-map

  3. Occupy Research Google Docs personal communication

PVI Source:

http://wheresthepartydoc.blogspot.com/2012/12/2012-cook-pvi-calculations.html

Bonica

http://data.stanford.edu/dime/

Original Data for Occupy Posted Below

Occupy Protest Inclusion--Decision Criteria

  1. Many cities were listed in all three sources, with various amounts of information, or contradictory information
  2. One event per city
  3. Most reasonable information (i.e., occupiers listed higher than NYC were rejected)
  4. Most information
  5. If a range was given, they were averaged (i.e., 100-200=150)
  6. If a number of protesters "+" was given, just the number was used (i.e., 40+ = 40)
  7. If "hundreds" was given, then 200 was used
  8. Highest population listed
  9. If there was no reported population, or was less than 5, a value of 5 was used
  10. If a city was in multilple districts, the total protesters were divided equally into the districts
  11. No effort was made to independently verify the existence of protests in a given city, or the number of protesters, other than the above criteria
  12. There may be errors in how I identified cities with congressional districts


Table 1-final data, Table 2-original raw data

Table 1: Final Data used for Mapping

Dist1ProtestsProtesters
AK019402
AL01150
AL0215
AL03125
AL051200
AL061300
AL07140
AR0115
AR022505
AR032300
AS0115
AZ0115
AZ0314000
AZ04125
AZ0515
AZ0721005
CA014360
CA029565
CA033120
CA041150
CA052300
CA0633805
CA0825005
CA0923200
CA101250
CA11124
CA121100
CA1315
CA143158
CA161300
CA172205
CA184305
CA193155
CA2013
CA2115
CA221185
CA233410
CA246595
CA2515
CA2715
CA2815
CA291100
CA3015000
CA33210
CA36210
CA3715
CA412105
CA43135
CA442305
CA4515
CA46398
CA472153
CA4811200
CA50210
CA5327000
CO0113000
CO021500
CO034403
CO04367
CO051500
CO515
CT0115
CT0215
CT032505
CT0515
DC15000
DE012155
FL011500
FL021300
FL031500
FL061100
FL072205
FL0813000
FL0915
FL1015
FL11255
FL132205
FL142405
FL15315
FL1711000
FL1815
FL193355
FL211100
FL223410
GA012300
GA0215
GA051150
GA0815
GA10275
GA1415
HI011200
HI029430
IA01315
IA022205
IA031350
IA041300
ID01315
ID02420
IL0118000
IL115150
IL121100
il14210
IL153417
IL162205
IL172100
IL181300
IL1915
IN01210
IN022105
IN031300
IN0421050
IN0515
IN06225
IN0711000
IN081100
IN091200
KS024370
KS0315
KS041300
KY0115
KY02210
KY031300
KY0415
KY062105
LA021400
LA041100
LA061150
LA07217
MA01451
MA023105
MA032115
MA0415
MA063125
MA0715
MA08210
MA0941047
MA101100
MD02170
MD0315
MD06315
MD071200
ME014130
ME02255
MI01180
MI0215
MI031400
MI052380
MI061500
MI0715
MI083510
MI1311000
MI154215
MN011150
MN0524100
MN07460
MN081100
MO0111000
MO051500
MO06210
MO072205
MO0815
MO0915
MS02150
MS0415
MT017810
NC0211200
NC041100
NC0611000
NC07210
NC091600
NC11315
NC121600
ND014220
NE011500
NE0211000
NH012105
NH02575
NJ021150
NJ07128
NJ0813
NJ0913
NJ10210
NJ12229
NJ13230
NM011500
NM02475
NM0321010
NV0111000
NV022350
NV0415
NY012320
NY0717500
NY1027650
NY1217500
NY1317500
NY1415
NY20210
NY2115
NY227620
NY23210
NY243505
NY251200
NY272205
NY2815
OH0111200
OH031300
OH05360
OH06150
OH091250
OH111150
OH12190
OH133325
OH161150
OK012305
OK02125
OK0415
OK052300
OR01210040
OR026680
OR0462115
OR052328
PA0115000
PA0315
PA05245
PA0615
PA0815
PA1015
PA112205
PA1215
PA153145
PA161300
PA173210
PA1813000
PA1915
R021500
RI011500
SC012320
SC02112
SC0315
SC043210
SC062155
SD014150
TN011130
TN021500
TN03150
TN051300
TN0615
TN072155
TX0115
TX051250
TX071300
TX1115
TX121200
TX131125
TX1415
TX1515
TX16150
TX17210
TX19255
TX201250
TX2315
TX2512000
TX26210
TX27360
TX3115
TX351100
UT01210
UT02312
UT0327
UT0412
VA0115
VA022170
VA031200
VA052125
VA06210
VA071200
VA0815
VA0915
VT0161455
WA01315
WA023755
WA034910
WA045455
WA0532055
WA0631405
WA0715000
WA0815
WA09315
WA2315
WI01120
WI021200
WI031120
WI0411000
WI0715
WI082240
WV01420
WV023110
WV032105
WY013125

Table 2: Original Data from 3 sources

Variables:

OrigMaxEst-Original maximum estimate from the largest event in a given city

RevMaxEst-Revised maximum estimate (using 5 for any lower, or missing values)

Dist1 - Dist4: Any congressional district where the listed city appears (may contain significant errors--please let me know when you find them)

ProtMultDist: Protesters per district--reflects having divided the total protesters per city equally into various districts where the city intersects.

StateTown/cityDate of first eventOrigMaxEstRevMaxEstDist1Dist2Dist3Dist4ProtMultDist
NYNew York CitySept. 17, 201130,00030,000NY07NY10NY12NY137500
AKKenai5AK015
AKBethelOct. 15, 201115AK015
AKUnalaskaOct. 16, 20111010AK0110
AKCordova10/16/20113030AK0130
AKSkagway10/16/20113030AK0130
AKJuneau10/15/20115050AK0150
AKHomer10/15/20116767AK0167
AKAnchorage8-Oct-118080AK0180
AKFairbanks10/15/2011125125AK01125
ALMobileOct. 8, 20115050AL0150
ALMontgomeryOct. 22, 20115AL025
ALAuburnOct. 15, 20112525AL0325
ALHuntsville7/10/11200200AL05200
ALBirmingham10/14/2011300300AL06300
ALTuscaloosaOct. 8, 20114040AL0740
ARJonesboroOct. 15, 20115AR015
ARConwayOct. 26, 20115AR025
ARLittle Rock10/15/2011500500AR02500
ARBentonville10/19/20115050AR0350
ARFayetteville10/15/2011250250AR03250
AZSedona5AS015
AZFlagstaffOct. 15, 20115AZ015
AZPhoenixOct. 14, 20114,0004,000AZ034000
AZPrescottOct. 6, 20112525AZ0425
AZTempeOct. 15, 20115AZ055
AZYuma5AZ075
AZTucson10/15/201110001,000AZ071000
CAGrass Valley10/16/20115CA015
CANevada City5CA015
CAMount Shasta10/15/2011150150CA01150
CARedding10/15/2011200200CA01200
CAEurekaOct. 13, 20115CA025
CAMonte Rio5CA025
CAPetalumaOct. 29, 20115CA025
CASebastopol5CA025
CAUkiah5CA025
CAPoint Reyes Station9/10/114040CA0240
CAarcata1/10/11100100CA02100
CAChico8/10/11200200CA02200
CAHumboldt1/10/11200200CA02200
CAAmador County5CA035
CAClearlake10/15/20114040CA0340
CAMarysville10/16/20117575CA0375
CAAuburnNov. 17, 2011150150CA04150
CALakeport10/15/20115050CA0550
CASacramento1/10/11250250CA05250
CASan Rafael5CA065
CASonoma10/14/2011300300CA06300
CAsanta rosaoct 15th35003,500CA063500
CAVictorville5CA085
CASan Francisco10/13/1150005,000CA085000
CABerkeley8/10/11200200CA09200
CAOakland10/10/1130003,000CA093000
CAWalnut Creek12/10/11250250CA10250
CAsan ramon2424CA1124
CASanta CruzSep-11100100CA12100
CAAlameda5CA135
CAHalf Moon BayOct. 4, 20115CA145
CARedwood CityOct. 28, 20115CA14CA182.5
CAPalo Alto12/10/11150150CA14150
CASan Jose10/16/2011300300CA16300
CASalinasOct. 15, 20115CA175
CAMonterey10/15/2011200200CA17200
CAModesto5CA18CA192.5
CAStockton12/10/11100100CA18100
CAMerced10/15/2011200200CA18200
CAGilroy5CA19CA202.5
CAFresno8/10/11150150CA19150
CAVisalia5CA215
CABakersfield10/15/2011185185CA22185
CAOxnardOct. 15, 20115CA235
CASanta MariaOct. 15, 20115CA235
CASanta Barbara6/10/11400400CA23400
CAAtascadero5CA245
CACamarilloOct. 5, 20115CA245
CAOjai5CA245
CALompoc10/15/20113030CA2430
CAVentura10/15-16/11250250CA24250
CASan Luis Obispo300300CA24300
CASanta Clarita5CA255
CASan MarinoOct. 5, 20115CA275
CAVan NuysOct. 28, 20115CA285
CAPasadena12/10/11100100CA29100
CALos Angeles10/15/201150005,000CA305000
CACulver City5CA335
CASanta Monica College5CA335
CACoachella ValleyOct. 11, 20115CA365
CAVeniceOct. 9, 20115CA365
CATorranceOct. 15, 20115CA375
CAYucca5CA415
CARedlands8/10/11100100CA41100
CAFontana12/10/113535CA4335
CARiversideOct. 15, 20115CA445
CARiverside10/15/2011300300CA44300
CATemeculaOct. 15, 20115CA455
CAHuntington BeachMar. 9, 20122020CA4620
CAAnaheim10/10/117575CA4675
CASanta AnaOct. 22, 20115CA47CA462.5
CALong Beach10/16/2011150150CA47150
CAIrvineOct. 15, 201112001,200CA481200
CAEncinitasOct. 15, 20115CA505
CAEscondidoNov. 5, 20115CA505
CASan Diego7/10/1120002,000CA532000
CADavis5,0005,000CA535000
CODenver9/24/201130003,000CO013000
COBoulder10/15/2011500500CO02500
COAspen8/10/115353CO0353
CODurango10/14/2011100100CO03100
COPuebloOctober 7th100100CO03100
COGrand Junction10/15/2011150150CO03150
COGreeley5CO045
COLongmontOct. 10, 20111212CO0412
COFort Collins10/10/115050CO0450
COColorado Springs4-Oct-11500500CO05500
COCanon City5CO55
CTHartfordOct. 7, 20115CT015
CTNew London5CT025
CTBranfordOct. 6, 20115CT035
CTNew HavenOctober 15th, 2011500500CT03500
CTDanbury5CT055
DCWashington DC10/15/201150005,000DC5000
DEDelmar5DE015
DEWilmingtonOct. 15, 2011150150DE01150
FLPensacola8/10/11500500FL01500
FLTallahassee10/14/2011300300FL02300
FLjacksonvilleoct 8th500500FL03500
FLGainesville11/10/11100100FL06100
FLSt. Augustine5FL075
FLDaytonaOctober 15th 2011200200FL07200
FLOrlando10/15/201130003,000FL083000
FLNew Port Richey5FL095
FLSt. Petersburg10/15/20115FL105
FLTampa5FL115
FLUniversity of South Florida3/11/115050FL1150
FLBradenton5FL135
FLSarasota10/15/2011200200FL13200
FLfort myers5FL145
FLNaples10/15/2011400400FL14400
FLCocoa5FL155
FLMelbourne5FL155
FLVero Beach5FL155
FLMiami10/15/201110001,000FL171000
FLKey West5FL185
FLLehigh Acres5FL195
FLBoca Raton10/13/2011100100FL19100
FLLake Worth8/10/11250250FL19250
FLDelray Beach10/15/2011100100FL21100
FLPalm Beach5FL225
FLWest Palm Beach5FL225
FLFt. Lauderdale10/15/2011400400FL22400
GASavannah9/10/11100100GA01100
GAValdosta8/10/11200200GA01200
GAFort Benning5GA025
GAAtlanta10/10/11150150GA05150
GAMacon5GA085
GAAthens5GA105
GAAugusta12/10/117070GA1070
GADalton5GA145
HIHonolulu10/15/2011200200HI01200
HIKauaʻi5HI025
HIKona5HI025
HIOahu5HI025
HIWaikiki5HI025
HIHilo6/10/115050HI0250
HIKahului10/26/20115050HI0250
HIKailua-Kona10/26/20116060HI0260
HIMaui10/15/2011100100HI02100
HIWailuku7/10/11150150HI02150
IACedar Valley5IA015
IADecorahNov. 5th, 20115IA015
IADubuque5IA015
IACedar RapidsOct. 22, 20115IA025
IAIowa City10/10/11200200IA02200
IADes Moines9/10/11350350IA03350
IAAmes10/13/2011300300IA04300
IDBoise5ID015
IDCoeur d'Alene10/15/20115ID015
IDSandpoint5ID015
IDIdaho Falls5ID025
IDMoscow5ID025
IDPocatello7/10/115ID025
IDSalmon5ID025
ILChicago8,0008,000IL018000
ILKankakee5IL115
ILNormal5IL115
ILStreatorNov. 30, 20115IL115
ILNormal and BloomingtonOctorber 56565IL1165
ILNaperville10/23/20117070IL1170
ILCarbonDale10/15/2011100100IL12100
ILAurora5il145
ILDeKalb5IL145
ILBloomingtonOct. 5, 20115IL155
ILCharleston10/17/20111212IL1512
ILChampaign10/15/2011400400IL15400
ILOttawa5IL165
ILRockford4/10/11200200IL16200
ILGalesburgOct. 17, 20114040IL1740
ILMacombOct. 21, 20116060IL1760
ILPeoria10/15/2011300300IL18300
ILSpringfield5IL195
INPortageOct. 22, 20115IN015
INValparaiso5IN015
INElkhart12/10/115IN025
INSouth Bend8/10/11100100IN02100
INFort Wayne10/15/2011300300IN03300
INWest LafayetteDec. 10, 20115050IN0450
INLafayette10/29/201110001,000IN041000
INKokomo5IN055
INAnderson5IN065
INMuncieOct. 19, 20112020IN0620
INIndianapolisOct. 8, 20111,0001,000IN071000
INEvansville10/15/2011100100IN08100
INBloomington9/10/11200200IN09200
KSTopeka5KS025
KSPittsburgOctober 12th1515KS0215
KSLawrence October 8th, 201150150KS02150
KSManhattan 10/15/2011200200KS02200
KSKansas City5KS035
KSWichita2/10/11300300KS04300
KYPaducah5KY015
KYBowling Green5KY025
KYOwensboro5KY025
KYLouisvilleOct. 04, 2011300300KY03300
KYAshland5KY045
KYBerea5KY065
KYLexingtonSept. 31, 2011100100KY06100
LANew Orleans6/10/11400400LA02400
LAShreveport10/15/2011100100LA04100
LABaton RougeOctober 22nd, 2011150150LA06150
LALake Charles5LA075
LALafayetteNov. 17, 20111212LA0712
MABerkshiresOct. 10, 20115MA015
MALenox5MA015
MAWilliamstown5MA015
MAAmherstOct. 5, 20113636MA0136
MASpringfieldOct. 10, 20115MA025
MAGreenfield12/10/115050MA0250
MANorthamptonOct. 6, 20115050MA0250
MAMarlborough10/15/20115MA035
MAWorcesterOctober 16th 2011110110MA03110
MANewton5MA045
MASalemOct. 22, 20115MA065
MAReading2020MA0620
MANew Bedford10/15/2011100100MA06100
MAJamaica PlainNov. 13, 20115MA075
MACambridgeNov. 9, 20115MA085
MASomerville5MA085
MANeedham5MA095
MAProvincetown5MA095
MAFalmouth8/10/113737MA0937
MABostonSept. 3010001,000MA091000
MAHyannis1014/11100100MA10100
MEBar HarborOct. 15, 20117070MD0270
MDAnnapolis5MD035
MDFrederickNov. 11, 20115MD065
MDHagerstown5MD065
MDCumberlandOct. 8, 201135MD065
MDBaltimore4/10/11200200MD07200
MEBrunswick5ME015
MEPortland5ME015
MESouth Portland5ME015
MEAugusta10/15/2011115115ME01115
MEPresque Isle5ME025
MEBangor12/10/115050ME0250
MITraverse City10/15/20118080MI0180
MIMuskegon5MI025
MIGrand Rapids8/10/11400400MI03400
MISaginaw5MI055
MIFlintOct. 14th375375MI05375
MIKalamazoo12/10/11500500MI06500
MISaline5MI075
MIBrighton5MI085
MIEast Lansing5MI085
MILansing10/15/2011500500MI08500
MIDetroit10/15/201110001,000MI131000
MIMarquette5MI155
MINiles5MI155
MIYpsilanti5MI155
MIAnn Arbor6/10/11200200MI15200
MNRochester150150MN01150
MNMinneapolisOctober 7th, 2011600600MN05600
MOarnold10/23/201135003,500MN053500
MNAlexandria5MN075
MNMoorhead5MN075
MNMarshall10/14/20112020MN0720
MNBemidjiOct 15th3030MN0730
MNDuluth9/10/11100100MN08100
MOSt. Louis1/10/1110001,000MO011000
MOKansas City3/10/11500500MO05500
MOKirksville5MO065
MOSt. JosephOct. 5, 20115MO065
MOJoplin5MO075
MOSpringfield10/15/2011200200MO07200
MOCape GirardeauNov. 5, 20115MO085
MOColumbia5MO095
MSJacksonOct. 15, 20115050MS0250
MSBiloxiOct. 15, 20115MS045
MTButte5MT015
MTGreat Falls5MT015
MTBillings10/15/20115050MT0150
MTkalispell10/17/20115050MT0150
MTBozeman10/14/2011200200MT01200
MTHelenaOctober 15th200200MT01200
MTMissoula8/10/11300300MT01300
NCRaleigh10/15/201112001,200NC021200
NCDurham10/15/2011100100NC04100
NCGreensboro10/15/201110001,000NC061000
NCFayetteville5NC075
NCWilmington5NC075
SCCharlotte8/10/11600600NC09600
NCAsheville5NC115
NCHendersonville5NC115
NCSylva5NC115
NCWinston-Salem600600NC12600
NDGrand ForksOct. 15, 20115ND015
NDMinot5ND015
NDBismarck10/15/20116060ND0160
NDFargo-Moorhead10/15/2011150150ND01150
NELincoln3/15/2011500500NE01500
NEOmaha10/15/201110001,000NE021000
NHExeter5NH015
NHManchester100100NH01100
NHConcord5NH025
NHConway5NH025
NHNashua5NH025
NHHanoverOct. 13, 20112020NH0220
NHKeeneOCT 15th4040NH0240
NJNewton10/15/2011150150NJ02150
NJMount OliveOct. 10, 20112828NJ0728
NJKearney5NJ08NJ092.5
NJNewark5NJ105
NJToms River5NJ105
NJPrinceton5NJ125
NJTrenton6th October, 20112424NJ1224
NJJersey City5NJ135
NJAtlantic CityNov. 5, 20112525NJ1325
NMAlbuquerqueOctober 6th, 2011500500NM01500
NMCarlsbad5NM025
NMLos Lunas5NM025
NMRoswell5NM025
NMLas Cruces10/15/20116060NM0260
NMTaos6/10/111010NM0310
NMSanta Fe10/15/201110001,000NM031000
NVLas Vegas10/15/201110001,000NV011000
NVCarson City10/15/20117575NV0275
NVreno275275NV02275
NVTahoe5NV045
NYSag Harbor10/15/2011120120NY01120
NYThe Hamptons10/15/2011200200NY01200
NYBrooklyn10/15/2011150150NY10150
NYAstoria10/28/20115NY145
NYGlens Falls5NY205
NYSaratoga Springs5NY205
NYAlbanyOct. 21, 20115NY215
NYKingston5NY225
NYLong Island5NY225
NYNew Paltz5NY225
NYPaltz5NY225
NYBinghamton10/15/2011100100NY22100
NYPoughkeepsieOct. 15, 2011200200NY22200
NYIthaca5/10/11300300NY22300
NYPlattsburgh5NY235
NYSaranac Lake5NY235
NYCortland5NY245
NYOneonta10/15/2011100100NY24100
NYUtica10/13/2011400400NY24400
NYSyracuse2/10/11200200NY25200
NYFredonia5NY275
NYBuffalo8/10/11200200NY27200
NYRochester5NY285
OHCincinnati8/10/1112001,200OH011200
OHDayton10/10/11300300OH03300
OHDefiance5OH055
OHFindlay5OH055
OHBowling Green10/19/20115050OH0550
OHAthens10/16/20115050OH0650
OHToledo10-Oct-11250250OH09250
OHCleveland7/10/11150150OH11150
OHColumbus10/10/119090OH1290
OHKent5OH135
OHAkron10/15/20112020OH1320
OHYoungstown10/15/2011300300OH13300
OHCantonOct. 15, 2011150150OH16150
OKBartlesville5OK015
OKTulsa10/15/2011300300OK01300
OKTahlequah8-Oct-112525OK0225
OKNorman5OK045
OKShawneeOct. 11, 20115050OK0550
OKOklahoma City7/10/11250250OK05250
ORSeaside8/10/114040OR0140
ORPortland6/10/111000010,000OR0110000
ORKlamath Falls5OR025
ORMosierNov. 5, 20112020OR0220
OREureka3030OR0230
ORBendOctober 15,1011150150OR02150
ORMedford10/15/2011200200OR02200
ORAshland6/10/11275275OR02275
ORCottage Grove5OR045
ORPort Orford5OR045
ORRoseburg5OR045
ORCoos BayOctober 15,10114040OR0440
ORCorvallis6/10/116060OR0460
OREugene10/15/201120002,000OR042000
ORTillamook10/15/20112828OR0528
ORSalem10/10/11300300OR05300
PAPhiladelphia6/10/1150005,000PA015000
PAErie5PA035
PAUniversity Park5PA055
PAState College10/17/20114040PA0540
PATemple11/11/115PA065
PADoylestown5PA085
PAWilliamsport5PA105
PAStroudsburg5PA115
PAScranton10/15/2011200200PA11200
PAAmbridge5PA125
PABethlehem/Lehigh Valley5PA155
PABethlehemOct. 24, 20112020PA1520
PAAllentown3/10/11120120PA15120
PALancaster10/15/2011300300PA16300
PAEastonNov. 17, 20115PA175
PAPottsville5PA175
PAHarrisburg10/15/2011200200PA17200
PAPittsburgh10/15/1130003,000PA183000
PAYork5PA195
RIProvidence10/15/201110001,000RI01R02500
NCCharleston10/15/2011150150SC01150
SCCharleston10/15/2011170170SC01170
SCHilton HeadDec. 29, 20111212SC0212
SCSimpsonville5SC035
SCGreenville5SC045
SCGreer5SC045
SCspartanburg10/13/2011200200SC04200
SCFlorence5SC065
SCColumbia10/15/2011150150SC06150
SDSpearfish5SD015
SDVermillion5SD015
SDSioux FallsOct. 15, 20115050SD0150
SDRapid CityOct. 15th9090SD0190
TNjohnson cityoct.15, 20011130130TN01130
TNKnoxville7/10/11500500TN02500
TNChattanooga10/15/20115050TN0350
TNNashville10/15/2011300300TN05300
TNMurfreesboro5TN065
TNClarksville5TN075
TNmemphis10/15/2011150150TN07150
TXTexarkana5TX015
TXDallas250250TX05250
TXHouston7/10/11300300TX07300
TXSan Angelo5TX115
TXFt. WorthOct. 10, 2011200200TX12200
TXAmarillo10/15/2011125125TX13125
TXGalveston5TX145
TXMcAllen5TX155
TXEl Paso10/17/20115050TX1650
TXBryan5TX175
TXCollege Station5TX175
TXAbilene5TX195
TXLubbock10/15/20115050TX1950
TXSan Antonio6/10/11250250TX20250
TXMarfa5TX235
TXAustin6/10/1120002,000TX252000
TXDentonOct 15th, 20115TX265
TXLewisville5TX265
TXBrownsville5TX275
TXPort Aransasoctober 15th15TX275
TXCorpus ChristiOctober 15th5050TX2750
TXTemple11/11/115TX315
TXSan Marcos5/10/11100100TX35100
UTOgdenNov. 6, 20115UT015
UTPark CityOct. 31, 201115UT015
UTMoab5UT025
UTSalt Lake CityOct. 7, 20115UT02UT04UT031.666666667
UTSt. GeorgeOct. 7, 20115UT025
UTProvoOct. 29, 20115UT035
VAWilliamsburg5VA015
VAVirginia Beach10/15/20115050VA0250
VANorfolk6/10/11120120VA02120
VAMartinsville5VA055
VACharlottesvilleOct. 15, 2011120120VA05120
VAHarrisonburg5VA065
VARoanoke5VA065
VARichmond10/15/2011400400VA07VA03200
VAArlington5VA085
VABlacksburg5VA095
VTBenningtonNov. 19, 20111010VT0110
VTUpper ValleyDec. 9, 20112020VT0120
VTRutlandNov. 9, 20112525VT0125
VTBrattleboro100100VT01100
VTCentral VermontOct. 9, 2011300300VT01300
VTBurlingtonOct. 9, 20111,0001,000VT011000
WABainbridge Island5WA015
WAMarysville5WA015
WAMt. Vernon5WA015
WAStanwood5WA025
WAEverett25-Oct-11150150WA02150
WABellinghamOctober 7th600600WA02600
WACentralia5WA035
WALongview5WA035
WAOlympia10/18/11200200WA03200
WAVancouver10/15/2011700700WA03700
WACle Elum5WA045
WALeavenworth5WA045
WAWenatchee7/10/114545WA0445
WAYakima10/15/2011100100WA04100
WARichland10/15/2011300300WA04300
WAColville5WA055
WAWalla Walla10/16/20115050WA0550
WASpokane9/28/201120002,000WA052000
WABremerton5WA065
WAPort Angeles10/15/2011200200WA06200
WATacoma10/15/201112001,200WA061200
WASeattle10/15/115,0005,000WA075000
WAEllensburg5WA085
WABellevue5WA095
WAFederal Way5WA095
WAPuyallup5WA095
WAPort Townsend5WA235
WIJanesvilleOct. 11, 20112020WI0120
WIMadison12/10/11200200WI02200
WILa Crosse10/15/2011120120WI03120
WIMilwaukeeOct. 15, 20111,0001,000WI041000
WISaint Croix Falls5WI075
WIGreen BayOctober 16th4040WI0840
WIAppleton10/15/2011200200WI08200
WVBuckhannon10/29/20115WV015
WVFairmontOct. 15, 20115WV015
WVMorgantownOct. 15, 20115WV015
WVParkersburg5WV015
WVCharlestonOct. 15, 20115WV025
WVDavisOct. 15, 20115WV025
WVMartinsburgOct. 15, 2011100100WV02100
WVOak Hill, FayettevilleOct. 15, 20115WV035
WVHuntington7/10/11100100WV03100
WYJackson Hole5WY015
WYCasperOct. 8, 20115050WY0150
WYCheyenne10/15/20117070WY0170