The other issue, the elimination of the "at large" seats, was also controversial, widely viewed as a partisan attempt to eliminate the consistently Democrat-elected at large council seats, and an invasion of city affairs by state legislators. Not counting the current 4 Democrat "at large" seats, Republicans on the Council would currently have the majority, 14 to 11. Both of these factors are partisan efforts that give Republicans an advantage in future CCC elections. Spoiler alert: my conclusion is that Republicans have a good chance of regaining the majority in 2015.
Some districts are easy to predict: there is only one candidate who filed by the major party deadline last February, or both filers are from the same party, in districts 1, 7, 8, 9, 10, 11, 14, 23 and 24. Two of those are Republicans, and seven are Democrat. Theoretically, a minor party candidate or independent could file by July 15, 2015, but a win would be highly unlikely, considering Libertarians, legally a "major party" rarely exceed 5% in city council elections.
Several other races have a natural advantage because an incumbent is running. The changing of the district boundaries make the incumbent advantage less important than it might otherwise, since, in some cases, the incumbent's previous voters may have been largely shifted into another district, or in 3 cases there are two incumbents running against each other: districts 3, 13 and 22. Some of the districts where an incumbent is running, and past voting gives that same party an advantage, I am predicting as "likely for that party." In most other races, I largely use past voting to predict the outcome.
Generating past voting data for the current CCC election is difficult for two reasons. First, it is an off-off cycle election: not only is it not on the 2-year mid-term cycle where we elect many of our state and federal officials (non-presidential election year), always an even year election, the Indianapolis city elections are on an odd year cycle, and there are no other candidates on the ballot other than for local races. Historically, this gives an advantage to Republicans, since there is exceptionally low turnout by all voters, but especially the Democrat base voters. I looked at the most recent, 2014 election (as did Paul Ogden in his race predictions), which would have a similarly low turnout compared to the presidential-year elections, but odd year elections suffer from even worse turnout than what one would find in mid-term elections. The second problem is that one can't look directly at the previous CCC election, because of the boundary changes described above. Below (Appendix 1), I summarize how I estimate the voting for current districts from the 2011 CCC election.
The following tables show the district-level votes for the 2011 and 2014 elections. The 2011 percentages (left-hand table) are unweighted averages of the combined district-level and at-large council races--these are estimates, generated with the process described below (Appendix 1). The 2014 percentages (middle table) are unweighted averages of the auditor, treasurer, and secretary of state races--these are the actual voting percents (not estimates). I have highlighted in red those party outcomes with less than 45% of the vote, and green for those party outcomes of greater than 55%. I have also highlighted in purple those Libertarian wins of over 5% (calculations were done in MS Excel). As can be seen, there is a satisfying consistency between the 2011 estimates and the 2014 actual voting averages.
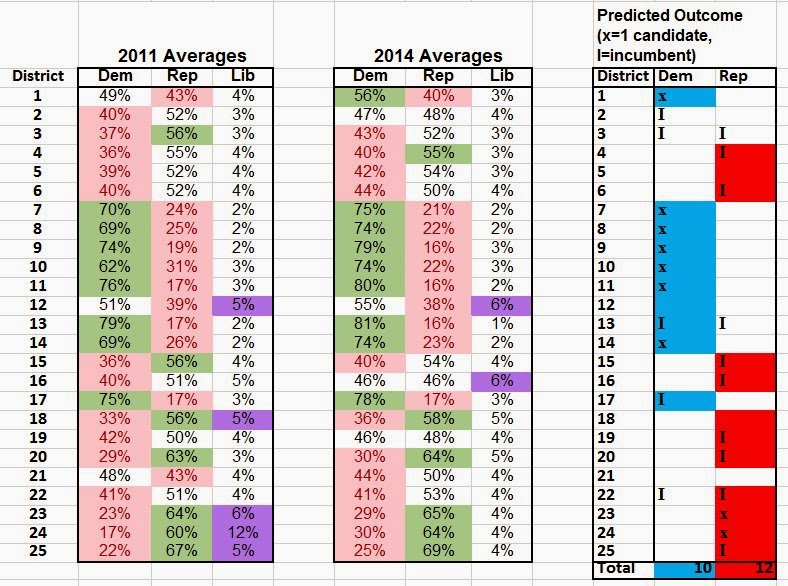
The right-hand table has my predictions for the 2015 race, based on past election results. Currently I am estimating 10 likely or secure seats for Democrats, and 12 likely or secure seats for Republicans, with 3 seats I am not willing to predict (districts 2, 3 & 21). Most of the districts where a substantial lead exists for either party, there is only one filer, so the race is not contested (except by multiple filers from the same party--districts 1 & 8, both Democrat)--those are designated with an "x" in the appropriate party column for the respective district (7 Democrat, 2 Republican). There are several races with an incumbent in a district where past voting gives that same party an advantage (1 Democrat, 7 Republican).
There are also several races with multiple incumbents running against each other--1 of those races seems to favor Democrats, and 1 Republicans, based on prior voted margins. District 2 has a Democratic incumbent, but prior voting gives Republicans a significant advantage (12%) in my 2011 CCC estimates, but only a small advantage in the 2014 election (1%). District 3 gives Republicans a significant advantage in previous elections (19% & 9%), but one incumbent is a prior at-large council-person (Hickman, Dem), against a district councilor (Scales, Rep). I do not know if that will impact voting decisions, so am leaving that race unpredicted. Finally, district 21 gives Democrats an advantage in the 2011 voting estimates (5%), but Republicans an advantage in the 2014 election (6%). The difference could be a preference for specific candidates, or an estimate error on my part. Either way, I am unwilling to predict that election, although if pressed, I would be likely to say it leans Republican based on the 2014 voting, the same as I might guess for district 3.
In any case, if my "likely or secure" predictions are accurate, Democrats would have to win all 3 of the unpredicted elections to retain the majority for the 2016 CCC, which seems unlikely. However, my predictions are based solely on previous elections. I refer the reader to Paul Ogden's site mentioned above, since he brings in pertinent local information, such as personality and funding factors.
Update: 1) Subsequently I posted campaign finances for the CCC candidates as of 3/12/2015. 2) I corrected an error in the 1st paragraph--I said that Vaughn lost the election, when I meant that he lost the majority presidency.
Appendix 1: 2011 Election Estimates Procedure Summary
For the 2015 prediction of CCC races, I used some geospatial mapping (QGIS) techniques to estimate how the past voting patterns would look based on the new precincts. Briefly, 1) I used GIS shapefiles of the old precincts with the 2011 CCC voting data, 2) overlaid that onto block-level census Tiger shapefiles, 3) calculated a factor variable that estimated the approximate mean number of voters for each block for each of the 2011 city-wide elections (mayor, at large CCC, district-level CCC) by party (Dem, Rep, Lib), 4) overlaid the new precinct-district maps onto the block-level voting estimates, and summed those values to get first precinct-level estimates, and then district-level estimates. To check the reliability of this method, I tested the correlation for straight-party voting for both Republican and Democrat by precinct, compared to the actual voting data from the 2014 election, obtaining r=0.88. I also compared the 2011 voting district-level estimates to the 2014 election for "registered voters," with differences ranging from 6% to 24%, and an average difference of 16%. While in absolute terms these are large differences, presumably the relative disturbance effects when comparing Democrat vs. Republican voters would be small--since I am comparing party voting within each district, not comparing districts to each other. (Some of this current work is based on mapping work I did in 2011-2012 to explore the outcomes of the Brooks maps using the newly drawn district maps)
No comments:
Post a Comment