Tuesday, August 28, 2012

Marion County 2008 Presidential Election Mapped!


Did you ever wonder what the political distribution was in Marion County? This Thursday, Common Cause is hosting a "Redistrict Indianapolis" all-day session at IUPUI (11 a.m. until 7 p.m. in Room 409 of the Campus Center at 420 University Ave; http://drawmarioncounty.org/). In preparation for this event, I have been working on the redistricting project I began last year using Quantum GIS, and the block-level Census and ACS data from 2000-2010. The map above is the precinct-level voting pattern of Democrat vs. Republican for the 2008 Presidential election. Blue is Democrat, red is Republican. Dark colors were >70% votes for that party, light colors are between 55-69% for that party, and white is 46-54%, which I considered a "swing" precinct.

By comparison, below is a map of the mayor's election last year. Very profound differences...

Friday, August 24, 2012

Corporate and Property Taxes are the Devil. Or Not.

In their book, Taxing the Poor, Newman and O'Brien test a two-fold hypothesis. First, as the "good Liberals" they are, they test the idea that higher taxes are required to build infrastructure and maintain community functioning, using variables such as individual-level health outcomes. Second, counter to expectations, they assert that we need to severely limit welfare spending in the South, especially the working poor. Their surprising argument is that federal programs like WIC, food stamps, and the Earned Income Tax Credit, primarily distributed to the working poor, actually become welfare to corporations. They build the case that when the federal safety net provides benefits to the working poor, it incentivizes and allows corporations to continue paying their employees wages that are below minimal living standards. Currently, a full-time worker at minimum wage would earn less than $15,000 a year, most of whom do not obtain any benefits, like sick-days or health insurance.

Their case is built on reconstructing a history of taxation in the various U.S. regions. The North, historically, has higher corporate and property taxes, which are state-level taxes, and get used for state-level projects. The South, on the other hand, had a successful series of tax revolts, especially after freed Blacks started going to school, using public resources that required the formerly “whites-only” usage to extend to a broader base. These new public resource consumers, in this case, typically did not own property, so it was argued that they were not paying for these resources, like education, roads, and fire and police protection. These Southern-based populist anti-tax revolts were driven primarily by property owners, who legislatively shifted state tax revenues from property and business to general sales tax, with the idea that all citizens end up paying into the system based on use and value—except property. Two states, Mississippi and Alabama, even continue to tax food. “Regressive” tax patterns like this ignore the fact that if you are at or below the poverty line, a 5-10% sales tax ends up being a far larger percent of your income than if you are middle or upper class, especially when they are necessity purchases, like food.

Most of these same stats also have very low corporate tax rates. The political argument is that lower corporate tax rates will attract businesses, which create jobs, thus creating a strong economy. Newman and O'Brien's data indicate that while this is true--unemployment has historically been lower in the South than in the North--the South still consumes far more Federal welfare resources per capita than any other region of the country. This paradoxical situation is explained by the fact that the jobs found in the South are far more likely to be low-paying service-level jobs, and therefore are not making enough to sustain a family. Indeed, their data indicates that those states in the South with the lowest property and corporate taxes also have the highest populations who qualify for food and housing assistance because of low wages.


In the charts above, I recreate Newman and O’Brien’s findings, using current data, not only providing support for their thesis, but finding that these regional differences still exist. The first graph compares corporate tax rates in each state versus the percent of children in that state with no insurance. The other two graphs compare property taxes versus the percent of the population of that state who qualify to receive the Federal Earned Income Tax Credit (i.e., those people who worked in a given year, but did not earn enough to get them above the poverty line, thus qualifying for a "tax credit"), and the percent of the population who qualify for the Federal Women, Infant and Children program. The straight black line is the “trend line” (using a least squares estimate). In each of these three cases, there is a directional trend--the lower the state corporate and property tax rates, the higher that state's requirement for federal aid to support a low-wage population

The table below the graphs shows three regions--Northeast, Midwest, and the South, documenting several tax and social-economic indicators. These relationships document a similar pattern as the graphs, but show more variables, such as the percent of the population who qualify for food stamps, the general population with no insurance, per capita income, and economic growth for 2012. In each case, a clear progression is evidenced: the Northeastern states are doing better on all of these social-economic outcome measures, the South is doing the worst, and the Midwest is in the middle. The theoretical link between these outcome measures and state tax rates, both corporate and property, is Newman and O'Brien's thesis that these state revenue sources allow states to take care of its population, without having to rely on federal aid—this data supports Newman and O’Brien’s original findings.

A related argument, is the relationship between taxation and economic growth. The neoliberal hypothesis is that higher tax rates lead to lower growth, since higher taxes limit the "job creators" ability to re-invest in their business, and similarly disincentivizing external investors. They propose that higher taxes are also related to lower worker wages, and higher prices, when business owners pass their losses on to their employees and the buying public. Each of these is proposed to limit economic growth. However, contrary to this prediction, higher tax rates in the Northeast are related to stronger economic growth, as measured by both GDP expansion and per capita income, compared to lower tax rates in the South which are related to lower economic growth. This pattern is evidenced in international data as well (Brady, 2010, Rich Democracies, Poor People).

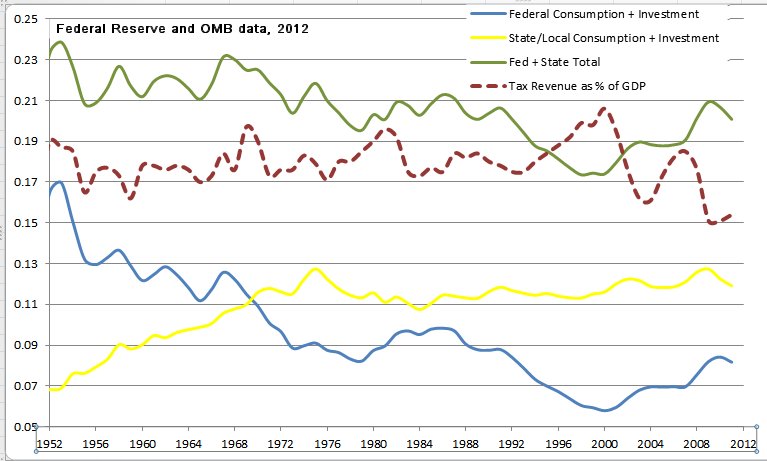
Finally, given that our federal tax revenues are as low as they have been in 60 years (see my analysis here: http://fallcreekrenovation.blogspot.com/2011/08/does-half-population-pay-nothing-in.html), does that mean all taxation is decreasing? Not at all--in fact what states have discovered is that as the national outcry against federal taxes becomes louder, national politicians respond by cutting federal budgets, leading to lower state subsidies—budgets requires for public goods such as roads, health, welfare, education and public safety. Given that these kinds of expenditures have a limited ability to be reduced and still allow for efficient public markets, states and cities have had to increase their budgets concordantly. The table below shows this trajectory. The blue-line, federal spending, has decreased substantially since 1952. However, the yellow line, representing state and local spending, has had to increase to keep up with federal losses.


Newman and O'Brien's argument is, on the surface, a typical "leftist" argument that there is nothing wrong with higher tax rates than what we currently have, and especially they argue for "progressive" tax systems that require the wealthy to put more back into the system than the poor. However, their secondary argument, is that businesses and property owners have a role in providing for the public good and the welfare of both their workers and the community in which they reside. The Southern pattern of attracting businesses by minimizing their tax rates is great for business profits, but it does little to provide funds for community infrastructure. Similarly, the data indicates that businesses that are willing to migrate to these low-tax states are often the same businesses who fail to provide a living wage or healthcare for their employees. This double-strike against communities becomes evident in the greater reliance on federal aid to supplement the wages that the businesses should be paying, and the health insurance that these businesses are not providing. In the end, while the expected "leftist" argument in the book might be that we need to strengthen the federal welfare system, the authors instead seem to argue that these resources should be provided at the local/state level, by requiring greater investment by corporations that do business in a given state, and property owners who enjoy the services of these low-paid workers.

Wednesday, August 15, 2012

Swinging in the United States

We are all familiar with "swing states"--those states that the pollsters and pundits believe are "up for grabs" for the presidential race, those states that cannot be predicted with some high degree of certainty which way they will vote, and thus to whom their electoral votes will go. On Jon Stewart tonight (Aug 15), Brian Williams of NBC news said that the road to the presidency is not even about "swing states," but is about "swing counties," and that there are about 12 of them. I just happen to have a spreadsheet with the presidential voting records for the last 3 elections by county. I did some analysis of this data.
I used the map from http://fivethirtyeight.blogs.nytimes.com/ to generate a list of the 9 states that they have listed with <81% probability who will win it: CO, FL, IA, MO, NC, NH, OH, VA, WI. Then I created 2 separate lists from my data set. The first list is all counties who had a swing in the last 3 elections, with just the last election having been a <5% win, and in swing states. The second list was of the counties in the U.S. with "close" elections for all of the last 3 elections (the victor having won with <5%), had "swung" in any of the last 3 elections to either side, and in swing states. Here are my two lists:
LIST 1LIST 2Swing States
Unemployment %
(June, BLS)
Electoral
Votes
FLFlaglerCOGarfieldNH5.14
IAGreeneIAGreeneIA5.26
IAPalo AltoIAIowaVA5.713
MOJeffersonMOBuchananMO7.110
MOWashingtonMOWashingtonOH7.218
NCCaswellVANorton CityCO8.29
NHHillsboroughFL8.629
NHRockinghamNC9.415
OHClark

Combining these lists leaves 14 likely swing counties. No county from WI made either list, so can be presumed an Obama win, despite Romney's pick of Paul Ryan for VP (Obama won WI the last election 56%-42%). Four MO counties are swing, and total, they comprise 6% of the state's voter turnout from 2008--all four went to Obama, but not by much.
Unemployment is often a key predictor for elections--the current national average is 7.5% (BLS, June). In this case, MO still goes to Obama, because they are below the national average with 7.1%. NH, IA and VA all have unemployment < 6%, so are likely Obama wins. OH is on the border with 7.2% unemployment, and CO, FL and NC are all above average, ranging from 8.2-9.4%. If we use these as predictors for the electoral votes, (above average unemployment states go to Romney, and below average go to Obama), then Obama wins 286-252. However, most pundit models give MO to Romney, in which case Obama still wins 276-262.
Despite my county-level-swing-state analysis, most pundit models have FL, CO and OH leaning towards Obama, generating an Obama win with >330 electoral votes (I haven't seen any models giving him <300 electoral college votes, as of August 15). Of course, swing counties aren't the only predictors, or even the primary predictors, since many of these counties represent <1% of the state's votes. Another important non-economic, non-demographic factor is whether candidates can generate turnout.

A bigger question for me, is if, as Brian Williams suggested, that strategists (people who do *real* analysis professionally, not my on-the-side hobby) have advised the candidates that there are 12 key counties in the United States that determine the presidency, what kind of democracy is this? This absurdity that we call the electoral college, that on the one hand, twice this century has given the presidency not to the person who won the popular vote, but to he who won the electoral college, and on the other hand, creates a situation where a handful of undecided voters in a handful of counties determine the fate of the entire country, and the candidates win these votes by pouring vast sums of money into those specific counties?

Coincidentally, last year, almost to the day, I posted an analysis of presidential voting patterns, the crux of which is that we almost always re-elect the sitting president, with the predictive variable being whether the economy was worse the 6 months prior to the election than when the president took office. Fortune-Telling the Presidency

Tuesday, August 14, 2012

GDP Growth Rates vs. Tax Rates


This is just a quick chart (for a Facebook conversation I'm having) that depicts U.S. growth rates (chained 2005 $, BEA data; units on the left) vs. top marginal income tax rates (units on the right) vs. GDP share taken by the top 1% (units on the left). The neoliberal hypothesis (i.e., lower tax rates will produce higher growth and a higher share of income by the most wealthy will allow them the confidence and capacity to invest, creating growth) is clearly not evidenced by the actual data. This hypothesis is based on an interpretation of the Laffer Curve, which presumes a bell-shaped curve--to the left of the peak of the curve, your tax rates are too low to sustain growth, and to the right, taxes are too high to sustain growth. The idea is to find the perfect "peak" for maximum efficiency. There is little empirical support for the Laffer Curve, and in fact, cross-cultural longitudinal data indicate that tax rates have very little impact on growth.

Monday, August 13, 2012

Federal Budgets By President


Based on a recent Facebook conversation about the federal budget where conservatives and I seemed to be talking passed each other, I generated a graph that helps explain our different languages. My earlier data analysis indicated that "government" has been getting dramatically smaller since WWII, as well as tax revenues. My conservative friends describe the exploding growth of government. Our language impasse seems to have been resolved by recognizing that my conservative friends were using budget "federal outlays" to talk about the growth of government, while I was using "federal consumption + investment" to talk about size of government. We are both a little bit right. Outlays represent every dollar that passed through federal hands, while consumption + investment represents just federal "spending." So, for example, federal consumption + investment money pays for the government workers, school programs, building roads, the buildings that house government, the military, etc. Outlays include other kinds of monetary transfers, like social security payments and interest on the federal debt. The government never sees that money other than to transfer it to the recipients. My conservative friends are correct, that these transfers have dramatically risen. However, these are projects that have been a long-time in the making. On the other hand, I am correct that the size of government, as well as tax revenues (see my earlier posting on that topic, represented by the dotted line) have shrunk. Both of which are at historically low rates, even under Obama, despite the rhetoric to the contrary. On the graph below, you will find the federal outlays (blue), the federal consumption + investment (red), and separated by presidential budget term. The vertical lines do not represent the year the president took office, but the year that his budget would have been enacted. So, for example, while Obama was elected in 2008, he doesn't generate his budget and submit it to Congress until the following year, and it doesn't get instituted until the end of that year. So I show his budget as being fully "enacted" as of 2010.