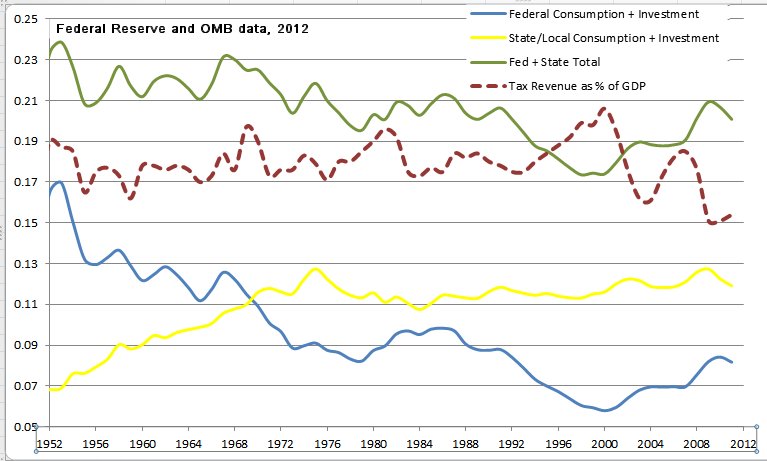
Notice that there has been relatively little change in government spending as a % of GDP since the 1950s. Total government spending has remained between 17%-24%, with the lowest levels during that period under Clinton (1998, 17.4%), and the highest under Truman (1953, 23.9%) and Kennedy (1967, 23.1%). As of 2011 we are at 20.1%.
Similarly, tax revenues as a % of GDP have been relatively unchanged. The highest levels of tax revenue have also been under Bush Jr (2000, 20.6%), and the lowest under Obama (2009, 15.1%).
No comments:
Post a Comment