Monday, August 15, 2011

U.S. Debt Pt 2: The Crush of Student Loans


This is a follow-up post from yesterday when I briefly discussed the composition of US debt. Table 3 showed the composition of entire US debt and broke household debt into 2 components--consumer and mortgage. Here is a more detailed breakdown of US debt from the NY Federal Reserve. As listed earlier, mortgage debt is by far the largest source of household debt and has recently dipped (scaled on the right hand side; the other sources are scaled on the left hand side), as have all other sources of debt except for school loans which have been rapidly increasing. While the other forms of debt represent a decrease in consumption and debt release from bankruptcies. Student loan debts do not fit into either of these patterns, therefore represent a new form of debt for two reasons.

First, student loans are exempt from bankruptcy, so cannot be released other than by payment. Second, a decrease in consumption (housing, cars, leisure spending) are reasonable choices when the economy contracts, when your personal wages do not increase with the cost of living, or when you have lost your job, and we see these reasonable choices reflected in the data. However, we are told that the only way out of unemployment is retraining and higher education, which is exactly what people are doing--going back to school. Often, these retrainings take the form of for-profit "schools" that promise to certify, license or train students for work. These options might be viable if jobs were available. However, in some parts of the country, like Los Angeles, the U6 unemployment is over 25%, and Indiana it is 17%. Moreover, the jobs that are waiting for the few that graduate with a 6-month or online degree will typically pay little more than minimum wage. As an example of the limited choices even for those with a 4-year degree, a local corporation that scores standardized tests from across the U.S. pays $10/hr, requires a BA/BS, offers no benefits, and its workers' minute-to-minute work is strictly regimented to limit worker interaction, and arrival and departure is like a cattle-call where the warehouse fills and empties within 15 minutes--no late arrivals or departures are allowed. There is no job security from month to month when new tests cycle in to be scored.

The effects of these changes cannot be positive for the future of the US economy, when its workers are using the bulk of their money to pay for an education, especially when many of the schools that are offering training, are for-profit institutions whose certifications will statistically never end in a job commensurate with the money invested. Not only this, but even traditional degrees are not guaranteeing a job that produces self-sufficiency. This represents a fundamental change in the economy, since traditional debt was at least producing something that grew the economy--buying a house represents the work of laborers to make the house, and property owners are motivated to engage in community work to maintain the value of their investment. Car purchases, and other consumer spending, goes back into the larger economy in the form of GDP and workers. Further, these other forms of debt can be released either by selling the property, or by legal dissolution. Educational debt cannot be resold, nor can it be dissolved, thus tying up the funds from future middle and lower class borrowers. This takes us back to the point from the first part of this essay, that if the US economy is built on consumer spending, as the data clearly indicates, the crush of debt subverts the mechanism that would help us grow out of this recession.

Sunday, August 14, 2011

Is Debt and Government Spending Crushing Us?


Table 1: GDP by Consumption

In the Republican Iowa debates I repeatedly heard the claim that government percentage of the GDP has skyrocketed. I have yet to see data that supports this claim. If you they are talking about raw numbers, then yes, government spending has increased. However, as a percent of GDP, government consumption has not, and it is the relative percent that is important. Not only is our government spending far less than other industrialized countries, but at least as far back as I can find at the Federal Reserve online data (1945), our government spending has been roughly the same, as indicated by Table 1. On a previous blog post, I charted the changes in "sector" growth since 1945, data from the BEA. Namely, manufacturing has gone down dramatically, service and finance has gone up dramatically, but, again, government spending has remained the same in the production measure as well (Table 2). That is two separate measures, production and consumption, where government percent has remained the same.

Table 2: GDP Production by Sector


Another issue is the larger economic model. If you go back to Table 1, you will notice that there are 3 major sectors of consumption that create the Federal Reserve measure: consumer consumption (which technically also includes non-profit spending), government spending, and business spending (which includes farm, finance, corporations--all business investments and inventories). By far the largest chunk of this is consumer spending--that means the money that you and I use to buy food, cars, tvs, movies, etc. Far above both government and business spending combined, is the money that regular people put into the economy by buying. This can only happen when consumers have money to spend. Here we can see a flaw in the neoliberal argument from the historical data. In earlier blogs I have charted that we are paying less in taxes than we have since 1950 (as a % of GDP), contrary to what we heard at the Republican debates. However, our disposable income has continued to decline, and wages have stagnated. The mantra of lower taxes have increased the income of the top 40% of earners, who have been saving and re-investing money, not spending it. Thus the largest driver of our economy, consumer spending, as shown in Table 2, while increasing slowly under Reagan and Clinton, leveled off or declined during all three of the Bush terms (Sr and Jr).

Table 3: U.S. Debt by Sector


The third piece of the recent rhetoric has been debt, thus the question, "Are we being crushed by debt?" to which I answer, yes. However, it is not government debt that is causing our economic problems, but household debt. As shown in Table 3, federal debt in the last 15 years, as a percent of GDP, is the lowest it has been since WWII (yes, you are reading the chart correctly--federal debt as a % of GDP after WWII was 70%, and did not reach current levels until the 70s). We have seen a rapid, recent increase in debt/GDP, however, it is the rapidity of the climb since 2005 to "average" levels that has caused us to perceive the shift as problematic. Whether as a comparison with other industrialized countries, or a comparison with our own history, our current debt/GDP ratio is unproblematic. The perception of the problem, and the potential real problem, is that since unemployment has dramatically risen, and wages have contracted, this shifts the debt/GDP ratio higher than it might otherwise look, as well as "feeling" like a crisis for households. When you look at the historical debt chart, the major differences since the 60s has been a radically lowered federal debt, a skyrocketing share of debt by the financial markets, and peaked levels of mortgage debt. The declines in financial and mortgage debts are evidence not of improved circumstances, but the bursting of the market bubbles that have led to debt-write offs, bankruptcies, and reassessed values, with federal support systems taking their place to prevent systemic collapse even worse than what it would have been. The larger trend for household debt, both mortgage and consumer debt combined, has remained relatively stable. However, given that total real GDP/capita (which accounts for cost of living increases) since 2000 has only increased 6%, and real income for the bottom 50% of earners has declined or remained stable since 1980, that means a declining disposable income after accounting for a debt ratio that does not decline. Decreased spending capacity by the majority of consumers means not only a diminished capacity for the economy as a whole to grow, but also an impoverished life for the growing number of citizens who have to live below the poverty line.

Friday, August 12, 2011

Fortune-Telling the Presidency


Can social science fortune-tell the results of the presidential election? Of course not. Culture is too complex, especially in an age of rapid technological change, globalization, and recent wild economic swings. Having said that, there are some historical precedents that can be useful.

First, of all the candidates in the 2000 election, 90% with the most campaign contributions won. This doesn't necessarily mean that money bought the election, since contributions themselves can be a reflection of who the voters liked best. As this relates to the upcoming presidential election, as of mid-July 2011, the Obama campaign earned almost 3x all of the GOP candidates combined, and it is predicted that Obama will get over $1 billion in contributions. That is a tough number to beat, even for millionaire front-runner Romney.

Second, as I mentioned in an earlier blog, while it seems like our nation is lurching back and forth between liberal and conservative politics, that switch isn't cultural, but rather, an artifact of our winner-take-all political system. Culture itself is fairly evenly divided, and most of us fall in a large centrist camp. Historically, our presidential elections don't seem to evidence a radical left and right cultural lurch, but a slow meander back and forth over the center. Here's what I mean--if you look at the presidential party changes since 1900, we have a fairly predictable rotation. We like to keep our presidents in office for their full 8 years, and at the end of a president's service, we like to switch parties. This may be an angry, lurching mandate against the party previously in office, but because of the predictability, I see it as simply a slow meandering back and forth. The longest stretch we have had with a 1-party presidential track were the FDR-Truman years for the Democrats (1933-1953). Otherwise, our next two longest stretches were the Republican between-World-Wars, Harding-Coolidge-Hoover years (1921-1933) and the Reagan-Bush years (1981-1993). In each of these three cases we saw a Vice President take office either by presidential death, or end of legal term, except for Hoover, who, it could be argued, was simply taking over for Coolidge's 2nd term, who had declined to run. Otherwise the rotation has been surprisingly predictable for the last 100 years: 8 years of one president, then switch parties.

Third, it is constructive to explain the divergences from the "8-year president then switch parties" pattern. While multivariate and complex, a simplistic model of two variables is highly predictive: 1) economic growth (GDP) during the year of the election, and 2) change in unemployment rate from the year prior to the election to the election year itself. As a baseline, I took these averages (median) just from the year of and prior to presidential elections with the following real GDP growth and unemployment rates, respectively, since 1904: 2.3% and -6.4%, meaning that the years of presidential elections, we tend to have an increase in real GDP growth of 2.3%, and between the year prior to an election and the election itself, we have an average decrease in unemployment rates of 6.4%. However, when we look at one-term presidents (Hoover, Bush Sr and Carter; I ignore Ford since he simply took over for Nixon, thus representing the end of an 8-year cycle), their ending economies had growth rates of -5.1%, and unemployment increase of +22.5% (48% for Hoover, 22% for Bush Sr, and 11% for Carter)! Further, the 2-year and 4-year averages are far less predictive, indicating that just the election year change itself seems to create a 1-term president.

Were there exceptions to these exceptions--namely, were there times when the economy was bad that we stuck with an incumbent president's party, or times when the economy was good that we changed from an incumbent president's party? Yes and yes, but they are exceptions that prove rule #2 above. Since 1913, we have only twice kept an incumbent president's party during negative economic growth and worsening unemployment, both during the between-World War elections of 1924/1928, and neither of these represented continuations of the prior president's two full terms. In the first instance we re-elected Coolidge for one term, who had taken over the presidency after Harding's death, followed by the election of Hoover for one term. The larger context is that at the opening of the 20s there was a profound spike in unemployment and a declining real GDP, ushering in a new presidential party with Harding. While both of these Republican elections (Coolidge and Harding) had slightly negative economic indicators, they were far better than that of the early 20s, and all three of these presidents combined still only create a 12-year run, none of whom could claim 2 full terms in office. On the other hand, we almost always rotate out presidential parties despite good economic indicators when their 8-year term limit is up. In fact, the only time we have failed to rotate out an incumbent president's party since WWII was Bush Sr, a Vice President, who of course lasted only one term.

For the upcoming election, each of these bodes well for President Obama. Clearly, it seems he will win on money, plus he wins on our historical proclivity for preferring 2-term presidents. The one factor that seems to be able to produce an historic reversal of this pattern, assuming the other patterns hold, is a worsening economy as measured by real GDP and unemployment. While the economy so far has been bleak, polls still show consistent "Bush blame" for the downturn, and similarly, there has been a widespread shift away from Republicans tied to Tea Party. Two questions that persist for me is whether this Bush/Tea Party-Blame will last until the end of 2012 when we actually go to the polls, and whether unemployment will improve. If we see some improvement, even a slight improvement between this year and next, Obama wins, assuming the statistical trends hold. However, even if conditions worsen, the other factors may override a negative economy, assuming Bush/Tea Party-Blame persists.

Saturday, August 6, 2011

Why the Tea Party, and Congressional Gridlock, are not a Surprise to the Social Scientist


The rise of angry, polarized debate in Congress, and in the country, is disturbing to most of us, who would prefer that our government just “work” and get things done, rather than bring our economy and the nation to a political standstill. However, for the social scientist, this is not unexpected in our current socio-economic climate. Two patterns are evident: first, the growing strength of anti-government social movements since the 90s, and second, increased political hostility leading not only to a breakdown in the ability to compromise, but even an inability to agree on facts.

Several patterns coincide that explain both of these trends. First, social movement analysis tells us that every successful movement has a counter-movement. The Tea Party was a predictable response to the profound success of the Obama campaign that appeared to lurch our country to the left. Similarly, the success of the Obama campaign was predicated on not only the previous lurch to the conservative side during the Bush years, but the coincidental crash in the economy, largely perceived to be caused by Bush’s policies. In the U.S. we hate taxes, based on our cultural values of meritocracy and individualism, and tax revolts have long characterized grass-roots movements by the wealthy and middle classes opposition to progressive taxation policies, especially when combined with recessionary trends. The rise of the Tea Party (who are demographically very similar in geography, values, and tactics to the Moral Majority from the 80s) is an unsurprising rejection of the apparent leftward shift, confirming a larger trend, that reactions to acute social shifts tend to keep our general trajectory fairly centrist.

Understanding this requires only that we remind ourselves that these “lurches” are not really lurches at all, but peculiarities of our political structure. To some degree, we have a “winner-take-all” political system, in that whoever wins a district gets 100% control of that particular vote. In the larger picture, there is some degree of power sharing, since both Democrats and Republicans jointly share responsibility for legislating and voting. However, each individual seat is responsible only to that one district, most of which have been gerrymandered into security. Still, most elections are won by a relatively small margin, in the 50-60% ranges. The winner-take-all system gives us “red states” and “blue states” with the appearance that everybody in those regions is on board for conservative or liberal policies. However, this is far from the case, when many “victories” are only confirmed with legal challenges that accept or reject a few contested ballots. When such victories are only won by politically-driven redistricting, and legal battles, the only thing that is clear is that our culture has a variety of strongly held opinions and not a convergence in one direction. Back to social movement theory: the rise of the Tea Party is a predictable response to the intersection of the success of Obama’s campaign to mobilize the youth vote, giving the appearance of a lurch to the left, combined with the economic crash of 2008 and skyrocketing unemployment. The critical explanatory fact is that the “lurch” was not a “real” lurch at all since U.S. culture and values haven’t dramatically changed—what changed was simply the temporary power structure due to a very successful campaign during a presidential cycle where there was widespread dissatisfaction with Washington.

The Tea Party itself is simply a political lurch in the other direction, but this time for different reasons. Namely, off-cycle elections are dominated by the extremes of both parties, where neither youth nor minorities vote, so conservatives typically have the advantage. In this case, barely 1/3 of eligible voters bothered to show up to vote. Of the Tea Party national-level victories, there was an average win-margin of 54% (i.e., 46% voted for the other candidate), and only 33% of Tea Party candidates won the states where they ran (i.e, 66% of TP candidates lost) --meaning, one could arguably make the case that the current Tea Party freshmen were elected by about 5% of eligible voters. This clearly does not represent a radical swing towards conservatism, just an artifact of a semi-winner-take-all system.

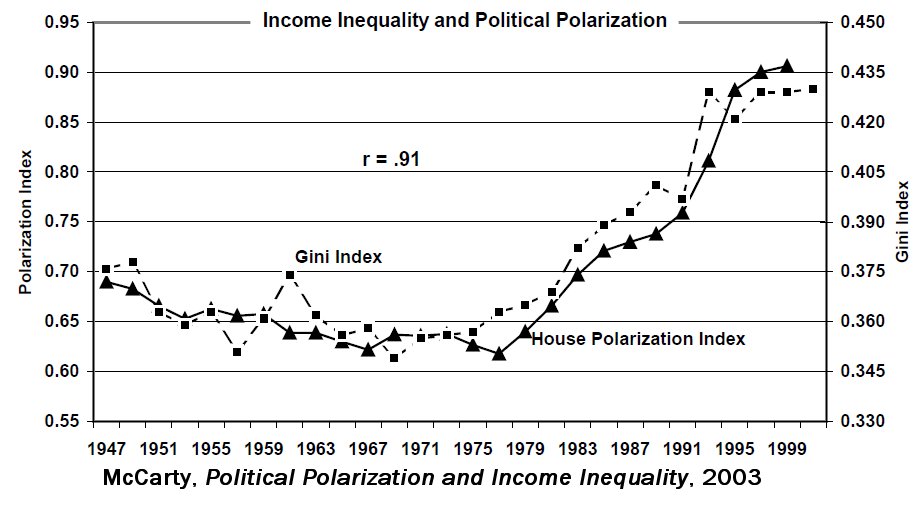
However, none of this answers the larger question of congressional gridlock and the extreme political animosity. This, also, is unsurprising to the social scientist, and it hinges on a fairly extraordinary statistic: the correlation between GINI and the House Polarization Index since 1947 is +0.91 (Table 1 at the top of the page). This requires some elaboration. First, social science rarely has correlations above 0.8—there is simply so much diversity between cultures and individual people that we are happy with a correlation above +0.6. In this case, +0.91 is astonishing. GINI is a standard measure of income inequality. In simple terms, it measures the gap between the wealthy and the poor—the higher the GINI, the more extreme is the socio-economic inequality. Not only is social inequality higher in the U.S. than we have ever seen since WWII, but the U.S. has the highest GINI of all industrialized countries, and the top decile share of income is greater than during the Great Depression. The House Polarization Index is essentially a measure of the gap between how parties vote in the House. Large values represent very little agreement between the parties, while small measures represent a large degree of commonality and cross-party voting. What the correlation means is that the income inequality measure, and political polarization, track almost perfectly—as income inequality goes down, polarization goes down, and as income inequality goes up, political polarization goes up. Both indices have been steadily increasing since the political turmoil in the late 1960s and the great economic crash of the early 1970s, from which our “real wages” have never quite recovered for the bottom 60% of earners (wages accounting for cost of living). The inequality itself can be explained by a number of factors, such as the long-term consequences of racial segregation and discrimination from the early post-WWII era; the change in our economy from manufacturing-based to service and finance-based; and perhaps even a loss of a sense of national shared sacrifice, so that rather than affirming the importance of social investment and helping the needy, we instead institutionalize individualism and a form of modern aristocracy.

Empirically, the data speaks for itself, and builds on work previously done by Habermas, when he explores the concept of the “legitimation crisis.” This is the third piece of this larger socio-political puzzle. Specifically, Habermas describes the processes of antagonism and ambivalence that characterize contemporary civil society. Ambivalence refers to the pattern whereby families and communities withdraw into themselves, and away from politics. We see this in many forms, such as a rise in leisure activities, personal spending, family vacations, religious isolationism, and a decrease in general civic engagement, when people become disillusioned with their government. One of the most dramatic expressions of civic ambivalence is the radical retreat from voting, as seen above, when only a third of the population bothered to participate in a national election. The other effect, antagonism, is expressed by anti-government, or “smaller government” social movements, and the Tea Party is a less extreme version of this trend. More extreme versions are seen in anti-government militia groups, which have grown since the 60s, as well as anti-government religious movements, like that seen most recently by the Warren Jeffs-led, FLDS clan. Both of these effects are what Habermas calls the “legitimation crisis”—when the people feel like government has failed them, specifically as it relates to a pummeled economy. This ties back to a radical shift in cultural belief about the economy after the great depression, as formulated by Keynes. Prior to the depression, most of us believed that the economic cycle (the ups and downs) were “natural” therefore unable to be fixed or broken by government intervention. However, after the depression, we were ready for a change of belief, and Keynes provided us the tools to make the change, by creating a new theory that allowed capitalist governments to inject money into the economy. True or false, the belief that the government could fix or break the economy took hold, and provides the basis for our widespread cultural rejection of political parties that are in power when the economy tanks—i.e., a legitimation crisis.

So do these ideas explain the recent battle in congress that led not only to gridlock, but which subsequently led to a downgrade in the U.S. credit by S&P? The good social scientist is loathe to claim that something as complex as U.S. socio-politico-economic phenomenon can be explained by just a few variables. However, these three ideas combine to provide a foundation for understanding recent trends, whether it is the apparent lurches left and right, or the intense political animosity. If it is reasonable to look at the intersection of these three ideas as a partial explanation, do they point us in the direction of any solutions? Yes, but none that seem politically viable in the current climate. First, if part of the problem of “lurches” is the winner-take-all system, where the representatives feel secure in taking extreme positions (and perhaps even insecure in *not* taking extreme positions), then a rethinking of redistricting is in order. Creating political boundaries that increase diversity, rather than political security, while far from beneficial for either party, is what is best for the U.S. citizens. Perhaps an even more radical solution, would shifting from a winner-takes-all plurality-based system to one of proportionate representation, as is already done in a number of politically-successful democracies. Second, campaign finance reform is also in order. Political scientists report that elections can be predicted 90% of the time by who raises the most money. Not only that, but since 2000, the amount of money it costs to beat a house incumbent has skyrocketed from about $500 thousand, to $2 million, and the average net worth of a House representative is $800 thousand, while the average citizen’s net worth is about $95 thousand. These differences make it clear that in politics, wealth provides a huge advantage to those who have it, and a huge barrier to those who do not. These patterns tend to exclude the voices who are not in the top quarter of wealthy U.S. families, and thus fail to adequately represent the majority of citizens. Restructuring campaign finance to limit private financing in favor of equalized public financing would help ameliorate some of these problems.

Third, and perhaps most intractable, is that it seems we must refocus on what U.S. citizens seem to fear most—stronger redistributionist policies that reinforce both infrastructure and safety net systems. All of the social sciences arrive at the same conclusion, that social inequality breeds greater social tension, declining economic growth, and hindered democracy. As Habermas explains, and as data supports, as the economy declines, so does our trust in government. What makes this especially problematic, is that it is exactly when the economy hits a crisis point that we have to pull together into national unity, which ultimately has to mean greater individual sacrifice for the good of the whole. Where infrastructure crumbles, so business crumbles. Where the poor are unhealthy, business loses productive workers. When children cannot get a good education, business gets a workforce that cannot do its job, and we lose a generation of potential innovators. All of this feeds back into an untrusting, unproductive society where everything grinds to a halt. Instead of believing that helping the poor is an act of helping society (and therefore ultimately ourselves and our community), we have instead convinced ourselves that helping the poor fosters laziness, increasing the population of characters that we see on Jerry Springer and reality television. When the unemployment and poverty skyrocket, as we have been seeing, our instincts are to withdraw and fight for the little we have left. However, this Hobbesian vision of the social contract seems to leave us only with a social structure that is left without any ability to lubricate the wheels of social cohesion and productivity, instead of drawing on a Lockean vision, where human cooperativity and shared sacrifice is what builds a strong society.

Friday, August 5, 2011

Does Half the Population Pay Nothing in Taxes?

I often see in op-eds, and from politicians, the sincere belief that half of the population pay nothing in taxes. Perhaps, if you're talking about income tax and federal tax. However, even if this were true (which it isn't), those people still pay many other kinds of taxes. Everybody pays into FICA (social security, medicaid, etc). AL and MS residents pay full taxes on food, and all other products are subject to sales tax everywhere. If you own property, there are property taxes, and even if you rent, those taxes are passed along to the renter. The primary argument is that people under the poverty line pay relatively little in federal income tax, which is largely true, but the other taxes have a large impact on the money you have available. If you earn less than $15K, sales and other taxes represent a large percentage of your disposable income, whereas if you make $250k, sales tax does not impact your ability to buy food and pay your home electric bill. Regardless, if you look at the actual data available from the IRS, the picture looks far more fair than talking points make it sound. These are the facts: the top 50% of workers pay 92.5% of U.S. income, however, those same workers monopolize 88.2% of all U.S. income.

Thursday, August 4, 2011

How has the Economy Changed since 1947?

In my Intro class we talk about how the economy influences cultural changes. In order to show how the economic sectors have changed since their grandparents' time, I created a chart based on the various sectors. The BEA only tracked this information starting since 1947, but the trajectory prior to 1947 is clear. Has government skyrocketed when compared to GDP? Not at all--in fact, the total federal, state, local has gone from an average of 11.5% to 12.7%, and while I merged federal and state/local in this chart, the numbers have reversed from what polls believe has happened. Federal has gone from 7.1% in the late 40s/early 50s to 4.0% in the 2000s, while state/local rose from 4.4% in the late 40s/early 50s to 8.7% in the 2000s. The biggest changes should not be surprising--manufacturing dropping almost half, finance doubling, services doubling, agriculture/mining dropping by almost half. The following chart is based on BEA data downloaded 2011, with Hodrick-Prescott smoothing.

Wednesday, August 3, 2011

The Good Samaritan, Shared Sacrifice, and U.S. Fiscal Policy

In the parable of the “Good Samaritan,” the founding Christian teacher encourages us to “love your neighbor as yourself,” and throughout all of the Jewish-Christian-Muslim scriptures, we are taught to care for the poor. The concept of helping others in our community is not new, but we may often question “who is my neighbor”? A fellow community leader asked Jesus the same question, to which he replied with the well-known story of a person who goes out of his way to help a “neighbor”—not his next-door neighbor, but a stranger from a neighboring region in which there was historically significant animosity, sacrificing his own welfare in the process.

As U.S. citizens, we continue to wrestle with similar questions. Most recently, our representatives in Congress, and here in Indiana, have been debating about government spending—ways to cut the mounting debt, ways to reduce our taxes, and ways to restructure our safety net programs, like Social Security, Medicare and family assistance. As with most intractable social problems, we face a tension between two important social values. First, we believe we have a right to keep what we have earned, pushing us to demand low taxes, which sociologists call “meritocracy.” On the other hand, our cultural generosity wants to ensure housing and food security for the truly needy, meaning increased social benefits, which can only mean higher taxes.

The problem is that meritocracy rests on several false assumptions. First, meritocracy assumes the pioneering, individualistic spirit, that we rise or fall of our own accord, by our own bootstraps. However, this isn’t the case at all. We are born into families which are poor or wealthy, which have a variety of social networks, and a variety of skill sets. Studies converge on the fact that our life chances are heavily dependent on the social status of our family, primarily its wealth base. Certainly the American Dream exists, and we have isolated parables of rags-to-riches success. But as a sociologist, our job is to look at population statistics—not what extraordinary individuals accomplish, but what do the majority of people experience in our everyday reality? In fact, the vast majority of children born into wealthy families stay wealthy, and children born into poor families remain poor. In our culture, we agree that in any game there will be winners and losers, but only if all players start out on a level playing field. The problem is that we don’t all start out the same, and decades of ignoring this has created a nation where our levels of poverty and inequality are greater than in any other industrialized country. Our fiscal policy based on meritocracy is the primary cause for this change.

A second false assumption about meritocracy is the belief that welfare increases poverty by incentivizing laziness. However, the data tells a different story. First, work itself is incentivizing. Except for sensationalizations on Jerry Springer, people want to work if jobs were available. But when the latest measure of full unemployment for Indiana (U6) is almost 17%, and a full-time worker at minimum wage makes just over the poverty line ($15k), the assumption of a fully employed, self-sustaining workforce is illusory. Second, we have accepted the mythology that hordes of welfare recipients are “welfare cheats,” living off our hard work. In fact, the combined food and housing assistance from the 2010 federal budget was 5% providing poor families with financial support equivalent to 1/3 the poverty line, and the best studies indicate that only 5-10% of welfare recipients can be classified as “cheats” (much of which is for accepting unreported food and financial assistance from family). The average rate of child poverty in the U.S is 21%, while the combined rate in the rest of the industrialized world is 10%. Cutting safety net programs only creates impoverished families, while those countries that invest in social goods (healthcare, education, jobs retraining, family assistance), tend to rank highest in health, democracy, and economic growth.

A third false assumption about meritocracy is that taxes “punish success.” This concern may sound reasonable when we hear that the top 50% of workers pay 93% of U.S. income tax (excluding sales tax and FICA). However, it becomes less reasonable when one realizes that the top 50% of workers earn 90% of U.S. income, and the bottom 40% of U.S. citizens have an average net wealth of $0 (that’s “zero”). Such beliefs forget that under Eisenhower, our top tax rates on the wealthy were above 90%, and our economy was doing great (6.1% GDP growth!), while, since Reagan, there has been a predictable correlation between low taxes and low growth. Real wages for the bottom 40% of workers have actually declined since Nixon, while the income of the top 20% has skyrocketed. Thirty years of the neoliberal experiment has not produced a stronger society, but instead, has ushered in the worst economy and job loss since the Great Depression. Economically speaking, neoliberalism was rooted in the belief that income tax rates of 30% produce an optimally efficient economy, based on a unique interpretation of the Laffer Curve. However, macroeconomists who are willing to make a guess about Laffer Curve optimality reject the 30% estimates, since the data simply doesn’t support it, instead putting the number closer to 50-70% for top marginal income tax rates.

We don’t like to hear any of this, because it violates the important social value of meritocracy. We have adopted a vision of the social contract that abandons our sense of shared sacrifice. After the victories of WWI and WWII, our country was on board for shared sacrifice, and we pulled together as a nation for large projects, like the WPA to build infrastructure, and top 90% tax rates. However, since then, our culture has shifted to a radical individualism with an emphasis on consumerism. From the end of the draft in the early 1970s, the tax revolt that brought Reagan to power, the evisceration of social help for poor children under Clinton, and finally the radical tax cuts under Bush, our society has cascaded into social policy that has abandoned the idea that we are a country united. Instead, we have created a country divided along class lines, and the poor have been left to fend for themselves, forgetting that the social contract is made up of everybody, not just those born into financially stable families. The larger issue is whether it reasonable to facilitate a political-economic system where half of our citizens have insecure food and housing, while transnational corporations outsource our jobs, do a poor job self-regulating the safety of their products and workers, and have widely publicized records of paying relatively little into the system of public goods (i.e., taxes). This brings us back to the same question raised 2,000 years ago—“Who is my neighbor”?

Tuesday, August 2, 2011

Trends in Tea Party States

Continuing my analysis of Tea Party demographics, I did a correlation analysis between various health, economic and social trends in states with the highest population density of Tea Party House Caucus members (TPC). As a reminder, in the social sciences, a correlation above 0.4 is moderately significant, and above 0.7 is very significant.

The highest correlation by far is firearm homicides for girls under 17: +0.82, meaning, radically greater young female homicides in Tea Party states, very low young female homicides in non-Tea Party states. In general, all of the firearm-related injury/death/crime data is very high in Tea Party states (suicide, injury, robbery, etc), most in ranges from +0.4 to +0.82. This data reflects the correlation between stricter gun laws and lower rates of firearm-related injury/death/crime, which parallels the relationship between states with stricter gun laws and Tea Party Caucus population density (stricter gun laws correlate with lower rates of TPC). Similarly, general murder rates were higher in TPC states, with a correlation of +0.42, as was property crime, +0.38.

The second highest trend is the relationship between TPC and % of total tax burden represented by income tax (comparing property tax, sales tax, and income tax): +0.50, meaning, the more you pay in income tax in your state relative to property and sales tax, the higher your TPC representatives, implying that you are more likely to want tax reform to lower your income taxes. Total tax burden as a % of GDP does not seem to be relevant, having a correlation of only +0.23, indicating a sole focus on relative income tax burden, and not on the total amount of your taxes you pay.

The third highest trend is median income (2008), with a correlation of -0.41, meaning, the lower your state’s median income, the higher your TPC, again perhaps implying dissatisfaction with your family’s ability to pay its bills in those states hit hardest by poverty. Interestingly, however, there seems to be no relationship between prime foreclosure rates (-0.07), subprime foreclosure rates (-0.08), income inequality (+0.10), full unemployment (U6 measure, 2010: -0.08), ratio of house price to median income (-0.15), or income change from 1998-2008 (-0.19). These correlations relate to Tea Party Caucus population density, but the relationships do not change significantly when measuring Tea Party Endorsed (TPE) population density. Income inequality for TPE is -0.37, which verges on significance, but doesn’t quite make it, ratio of house price to income is -0.36, income change is +0.32, foreclosure rate is -0.30. The numbers look different, but none really represent strong correlations. The highest correlations for TPE were suicide death (from 1999-2007), +0.41, and population density, -0.39, meaning, more suicides in states with more TPE and fewer large cities in states with more TPE.

I also analyzed religious trends, assuming I would find differences. However, there seemed to be little difference in % of Christians (+0.33), % change in church attendance from 1990-2008 (+0.23), and % change in other religions (+0.19).

Friday, July 29, 2011

Is the "Debt Crisis" a "Crisis"?

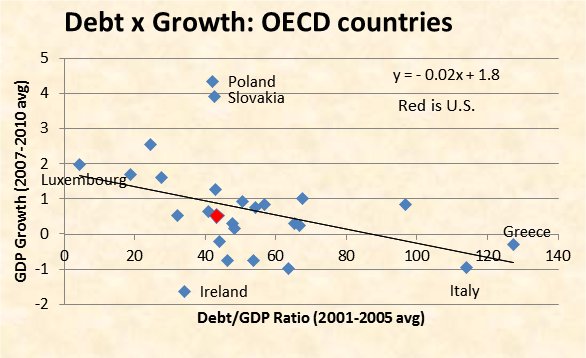
Here is some data I put together based on the debt to GDP ratio for my Intro Sociology class, when I introduce the idea of "social panics" (the Salem Witch trials are a great example--we have a "panic" about every decade).


1) We look pretty much like all of the other OECD countries, whether you're talking about growth, or the debt to GDP ratio. Chart 1 is a plot of growth vs. debt/GDP of the OECD (high income, industrialized) countries. The red dot is the U.S.


2) We've been here before, in the 50s, and our economy was doing just fine. (Chart 2)


3) Has there been some radical change in how much we are paying in taxes? Yes--since WWII there has only been one brief period when our tax revenue was as low as what we are paying today relative to our GDP--by far. (Chart 3)


First Public Campaign Speech

I gave my first public speech today. I gave one to a small group of supporters last month, but this was a "street speech" at a protest of the proposed cuts to safety net programs, contrasted with the continued failure to address the fact that many large corporations are finding ways to pay no taxes (usuncut.org). Here is a copy of the speech:

While Congress has been debating budget policy, transnational corporations and plutocrats are winning. Conservatives assume that every person is a self-sufficient island, each of whom starts life on a level playing field with everybody else, therefore in the game of economics, everybody is entitled to keep all that they win. However, they forget that we are all born into differently endowed families, and our life chances are tied to those resources (or lack thereof). The vast majority of poor remain poor, and the rich get richer, while our rates of poverty and social inequality in the United States are greater than in any other industrialized country and reached crisis levels decades ago.

Conservatives assume that safety net programs increase poverty by incentivizing laziness and slow economic growth by draining resources from productive workers, thus taxes are better left in the hands of mega-businesses and the new U.S. aristocracy. However, most people want to work if jobs are available, but when full unemployment and underemployment is at least 17% in Indiana, and a 40-hr week at minimum wage provides poverty line wages ($15k), the assumption of viable work is faulty. The average rate of child poverty in the U.S is 21%, while the combined rate in the rest of the industrialized world is 10%. Cutting safety net programs only creates impoverished families, while those countries that invest in social goods (healthcare, education, jobs retraining, family assistance), tend to rank highest in health, democracy, and economic growth.

Finally, conservatives assume that taxing the wealthy punishes success, which sounds plausible, given that the top 50% of earners pay 93% of U.S. income tax. However, those same earners monopolize 90% of income, while the bottom 40% of families in the United States have an average net wealth of $0. Further, real income for the bottom 60% of workers has stagnated since Nixon, while the income of the top 5% has doubled. Thirty years of the neoliberal experiment has not produced a stronger society. Rather, it has eviscerated the social contract on which our country’s vision was founded. The larger question is whether it reasonable continue supporting a system where half of our citizens have insecure food and housing, while transnational corporations outsource our jobs, disregard the safety and welfare of their employees, and have widely publicized records evading all taxes?

Thursday, July 28, 2011

Debt Ceiling Shenanigans

As with most of the rest of the country, I've been enthralled with the soap opera drama of Congress: will they or won't they? As the August 2nd deadline grew closer and no plan seemed to appear, I grew more skeptical that they would reach a compromise. I even spent 2 days collecting and analyzing demographic data about the current House of Representatives, especially Tea Party endorsed representatives, who have been holding up the process.

Then tonight I realized that the Democrats only need 25 Republicans to vote for the debt ceiling increase. Normally they would need 218 votes, but with vacancies and illness, they need either 216 or 217. One of those ill is a Democrat, so they have 192, which means that if they all support raising the debt ceiling, then there only has to be a few Republicans who prefer not to cause a collapse in our global economic trust when the first of our bills start to go unpaid. None of the tax reform/spending cuts/hula hooping even needs to get attached, and the congress will again have wasted months creating fun political theater for the voters back home and 24-hr news corporations.

The cynical may argue that those Republicans will face losing their seats during the next election, since the Tea Party has promised to run challengers to any defectors. However, as a sociologist who has studied social movements for years, whenever there is a movement there is a counter-movement. This is especially the case when the first movement is loud and threatening. Take the Tea Party--it is a counter-movement to Obama's success. The Tea Party has brought the country to what is perceived by most to be the brink of economic catastrophe, piled on top of the mess perceived to have been left by Bush, not to mention the fact that this class of freshman TPers was elected in year when only 1/3 of us bothered to show up at the polls. Which means this: Tea Party challengers will pose no danger to Republicans who vote for the debt ceiling to be raised. Moreover, the challenge for the Tea Party is to not get booed off every stage in the next election. All they have done is handed Democrats control of the House in the next election, and assured Obama that he can take it easy next year (provided of course that unemployment doesn't spike next October). At this point it doesn't matter which side is ideologically right or wrong, since public perception has consolidated to the belief that the Tea Party is the source of this logjam, and when it comes to politics, perception is all that matters to agitated voters.

Tuesday, July 19, 2011

Officially a Candidate

A trip to the city-county building today confirmed that I'm officially a candidate with 183 signatures. All of the legwork with hot, sweaty days knocking on doors paid off. Not only meeting people and hearing their concerns and thoughts, but with a candidacy confirmation.

The next step, the campaign, sounds equally as challenging, since none of this is remotely familiar, despite having read numerous books and studies about social movements and political sociology.

Since it is feeling more real, I checked out a book from the public library, "Mayor of Castro Street," by Randy Shilts. He tells the story of Harvey Milk, who won a seat on the San Francisco Board of Supervisors. I thought the biography would give me insight not only into city politics, but being an out, gay city politician.

I soon hope to arrange a meeting with my two competitors to get a sense of what the next 4 months has in store, and ideally, arrange a public debate between us, so the public can get a sense of who we are, what we think is important, and how we might differ in our approaches to city politics.

Thursday, July 7, 2011

Still Pending--No Word Yet

It's been a week since my frantic last-minute signature-gathering effort and I'm still in "pending" status. I called today to see if there was an update and there is none. The voter registration office has some internally conflicting information, and the person who actually makes the decision to certify me is out of the office until next week. They have me on record for more than my required signatures, but the process hasn't been made official for some reason, and the office can't tell me why. I also was told that any of the people I registered to vote, who also signed my petition, cannot be added to the valid petition signatures if their voter registration was not verified prior to the certification deadline.

Friday, July 1, 2011

Frantic Canvass

Several days after what I assumed was my final canvass, I called to confirm that I had plenty of signatures. The previous week I was confirmed at 148, so over the weekend I went out by myself in a neighborhood adjacent to mine, and collected almost 30, and was expecting around 15 from a woman who had volunteered to canvass in Broad Ripple. Combined, even if the city continued to kick out signatures at a rate of 40%, that would still put me over my minimum signatures. Signatures had to be turned in at 12:00PM on Thursday, so when I called at 10AM, I was told I still only had 148, and 20 of those were still "pending" (voters I registered, whose identities still needed confirmed)!!! The first few workers I talked to did not have a record of the 30 I turned in on Monday, nor the other volunteer, whom I had been unable to reach for over a week. I was advised to run out and get as many signatures I could in the hour that remained and get them in the office by the deadline. I was able to get 4.

Fortunately, the other signature sheets were found, and by 1PM I was told I was over my minimum signatures, as long as the voter registration "pendings" were confirmed. I won't know for certain if I'm officially on the ballot for perhaps 2 weeks, when I'll received a letter telling me that I had the minimum signatures to be certified as a candidate.

Now I have to find a "committee" and a "treasurer." I put these positions in quotes, since I have no idea what they are or where I might begin to find them. All these forms and deadlines... I have never been good at administrative tedium, being far better at research and analysis. For example, I recently completed an economy simulator for my students, that incorporates OECD data for the last 20 years, comparing government policy (taxes, spending, etc) on various outcome measures, like health, violence, and economic growth.
Economic Policy Simulator

Monday, June 20, 2011

Canvassing (Part II) and Stumping

We thought we were close to being done with the canvas to get a 2nd candidate on the ballot for my district, so we could actually have democracy in my neighborhood. The election board has been incredibly helpful in keeping us informed about what they are accepting and what they aren't. Unfortunately, of the 180-ish signatures we collected, they are only accepting 111, meaning about 40% of the community we tried to include into the political process, have been disenfranchised. Granted some of those citizens should legitimately have been excluded, since they are outside of my district. But our estimate was that accounted for less than 10% of our signatures after we went back to our district map to check the addresses.

Today I started again in my area. My helpers from last week gave all they were able, and I can't believe how much help I had. The total work was about 50 hours, coming up to about 2 valid signatures per hour. Hopefully I had better luck today, since the income levels in the neighborhood I canvassed today is greater than Hovey, Ralston, Caroline and Guilford streets from last week. It's a shame when I can feel safe in assuming greater political voice of a citizen based solely on income level. Then again, data indicates this is the case, when the median net worth of a US citizen is $95k, for a US house representative it is $800k, and the median net worth of a U.S. senator is $1.7M (2008).

I don't get them often, but I occasionally run into the cautious person who won't sign because they want to "investigate who I am" first. I've been trying to decide if they really believe this line, since certainly they won't do any "investigation," or if they believe it's a polite way to say "no thanks." It's certainly any person's human right not to sign a document that grants them voting rights, and given our 35% voter turnout, that sentiment seems to be normative for our culture. I suppose I shouldn't complain since I was a voting protester for 20 years, but in this case it seems like a very different kind of decision. In my case, I consciously decided that I could foster democracy and humanitarianism in ways that did not lend support to power-politics. In the case of these folks who are refusing to sign the petition, they either like the current candidate and don't want him to have competition, or they don't want to be bothered and I suppose they are too polite to just tell me to go away. I have had several of the "get off my property"-type folks, who I have grown to respect more than these other types of citizens.

Yesterday I gave my first public "stump speech" to a small group, which won me my first political endorsement. Here is the speech that I read:

"Government and business are fundamentally different social structures. Especially in the United States where our laws and culture have developed to prioritize the individual consolidation of wealth, even when it harms the public good. This unification of culture and legislation has ramped up since the 1980s, such that both Republicans and Democrats have succumbed to the mythology of neoliberalism, that low taxes on the wealthy will allow them to invest in business, and cutting benefits for the poor will encourage them to go work. But neoliberalism ignores fundamental patterns of human behavior. First, humans derive fulfillment from work. Both Democrats and Republicans seem to assume that the poor are inherently lazy and inclined to criminal behavior, and that the wealthy are inherently inclined to invest in employment. However, 30 years of data, beginning with the 1980s, confirms that the wealthy tend to hoard wealth, and the poor will work if jobs are available. The tragedy is that the number of jobs has been plummeting, since corporations are more willing to send those jobs overseas where workers are little more than slaves and are far cheaper than U.S. workers. Similarly, corporations, rather than investing in the common good, invest primarily in projects that benefit their board and their investors, even if it means dangerous working conditions for miners or oil riggers, or dangerous products for U.S. consumers. Rather than increasing funding and transparency for public safety, neoliberals in both parties prefer to strip this function of government, assuming falsely that corporations are inherently incentivized to maximize worker, consumer and public good, when in fact, the record shows they are incentivized only to maximize profit at any cost.

What the record shows us, whether Reagan, the Bushes, Clinton, or Obama, is that government does not need to be stripped of power as such, but the government needs to be returned to a social structure that is by and for the people, one that protects public safety, worker compensation, and the re-enfranchisement of the poor. This can only occur with an educated, empowered population who have the capacity to affect public policy. Locally, both Democrats and Republicans have been voting to sell public goods to private entities, and to disenfranchise women, racial minorities, sexual minorities and the poor. Our response to this must be to empower third party candidates and remember , when voting, that the wealthy and corporations already have far more power than they need, both of which have been consistently empowered by the current two-party system, while stripping the poor and middle class of political voice."

Saturday, June 18, 2011

Canvassing Day 5

Today took a warm turn--it started to get hot, and made canvassing difficult. The street we were on seemed like a nice, quiet street, although still poor and with a lot of empty houses. However, residents said it was simply an unusual day, since normally the warm weather brings loud neighbors out of their homes to hang out on street corners.

What was supposed to be the last day of canvassing, a thought that helped me get through the hot afternoon, turned out to be far more demoralizing. The city-county workers have been very helpful so far. However, today they had to inform me that they are throwing out over 1/3 of the names we have worked so hard to collect. Various technicalities, including things like putting an address on the petition that was next door to where they were registered to vote. We went to poor neighborhoods partly to empower the residents by meeting them and including them in the political process. Now that they have joined the political process, their voices are being silenced by the bureaucratic process. Not only is this disappointing for the residents, but that also means that I have several more days of canvassing during a week when it is supposed to be hot and stormy.

Canvassing my own neighborhood later that night after this bad news was further demoralizing. I assumed if I waited until 6pm that I would catch people when they got home from work. However, I had failed to remember that the data indicates that since the 1980s, workers have been taking fewer vacation days per year, and working more hours per week. I found this to be true in my neighborhood which is being populated by under 40s professionals. As late as 6pm, on average I found one person home for every 2 blocks, and I didn't see people start coming home until after 8pm, which I felt was too late to impose, plus it had already been a long day of disappointments.

The positive for today is that I had my first Letter to the Editor published in our local paper. I have never thought about writing one, since I never read them. As a social scientist, a positivist no less, I typically don't read anything other than news and studies--I don't read fiction and have even less interest in the opinions of random people. In fact I tell my students at the beginning of all of my classes that I don't care about their opinions, and they shouldn't care about mine, that as a professor my job isn't to tell them about opinions, but to teach them about scientific research and data, and how to extract fact from opinion. So it felt like a step backwards to write and publish something that was going to be called an "opinion." However, several of my colleagues said that a letter to the editor was a good way to "announce" my candidacy. So while the letter was published, the responses were dismally predictable--readers saying yes or no, with no interaction with actual data.

This lack of interaction with real data is one of the tragedies of our "modern" political system and a profound deficit in our public discourse. Neither politicians, nor the public, listen to real data, and have become, instead, convinced that you can find any study to prove anything you want, having little understanding that there is a mountain of "good" data available, but haven't been taught to distinguish opinion polls from scientifically collected peer-reviewed research, or empowered to feel like they can state fact from opinion. Take the recent economic crisis. The federal government commissioned several groups to advise them how to handle public policy. The Congressional Budget Office, comprised of bipartisan and non-partisan social scientists to put together a plan for creating jobs. Lowering taxes on the wealthy was at the very bottom of the list for what would create jobs. However, the entire public discourse, and the primary political strategy, was to lower taxes. Similarly, when the president commissioned the debt commission to advise us how to deal with the national debt, it was completely ignored. Rather than following the data, our politicians are simply following opinion. The utter lack of respect for science has permeated our culture, and is contributing to a lack of hope by the public, and a lack of viable policy from politicians.

Thursday, June 16, 2011

Canvassing Day 4

Canvassing started up again today. A third person joined us, and we continued back into a blighted area. I didn't register any voters today, whereas I think we have registered about 25 people earlier in the week. Today I got slowed down because one of the residents decided to argue about issues for 45 minutes. He spoke from experience, which has to count for something--but he seemed to have a fairly limited field of social networks, from the middle-class as opposed to the poor. While I was arguing about Democrats in City-Council who have been voting like Republicans, failing to support the poor, he adamantly denied that the city-council's and mayor's policies were disenfranchising the poor. Considering his surroundings, an extremely poor community, it was difficulty to understand his motivation or his reasoning. I thought perhaps he had a personal connection to his city-councilor, Jackie Nytes (who is leaving), but he hadn't even heard of her. He also had several misconceptions about charter schools, and was FIRM in his (wrong) beliefs, like the belief that most charter schools around the nation are doing better than public schools (only 3% are doing better than public schools), and that Peterson didn't put any special guidelines on charter schools (which he did, making them follow the same restrictions as public schools, guidelines that Daniels' plan wants to rescind).

Wednesday, June 15, 2011

Day 3 of Canvassing

Three of us were supposed to canvass today. The previous 2 days there have been just 2 of us. However, it was supposed to storm all day so we cancelled the outing. However, the rain let up so I canvassed my neighborhood by myself. Our previous canvassing was in very poor areas with high unemployment. My neighborhood is transitional, with quite a few wealthy people who took advantage of low home prices from the gentrification process, as well as long-time residents who were able to keep their homes, despite attempts to force them out by high taxation and incessant citations.

I had a neighbor question about something that I thought was fundamental common sense. By the posters she had around the house, she clearly has an interest in education, and I assumed we would agree that strong schools create the foundation for strong communities. She visibly shut down at that point and called me a social engineer. I wasn't sure what she meant by that and when I asked for clarification she acted like I wasn't worth her time if I didn't understand why having safe, educated children was social engineering. She wouldn't sign my petition, which is fine, but considering there's only one person on the ballot for our district, I hope she realizes that refusing to allow anybody else on the ballot means that there is no democracy.

On a more positive note, later in the day I met with another local candidate who is also trying to get on the ballot, but for state, whereas I'm running for city. She and I had a great talk as she talked about her previous experiences running and shared ideas.

Tuesday, June 14, 2011

Day 2 of Canvassing

The second day of canvassing went as well as the first. Not as many vacant houses, but still a lot of unemployment, so there were a lot of people home during the day. Like yesterday, people were eager to talk about issues and expressed dissatisfaction with both parties. Running as an Independent seems to be working to my benefit so far, although we've been targeting districts that will tend to be supportive of Independents. I also canvassed my own neighborhood, and am getting almost unanimous support. Interestingly, the residents in my neighborhood don't know I live near them, yet they aren't asking any of my political views. In the poorer areas, they seem more engaged.

I filed my paperwork for candidacy today and things went smoothly. The man who is acting as my campaign manager worked on Nader's campaign and has horror stories. The election board and voter registration were obstructionist. The citizens they were asking to sign petitions wouldn't sign. I don't know whether it's the district, a change in times, or something else, but since I don't take rejection well, so far it's been a great experience.

We're more than halfway through and it's just the 2nd day--I've got 100 signatures so if we double that, it's far more than I need. But now I'm exhausted from walking all day, talking to strangers, and shaking hands, and I haven't even walked the dogs yet.

Monday, June 13, 2011

Today I announced my candidacy for office--Independent for District 9, Indianapolis, IN

Today I began my first public campaign for office. I am running for city-council district 9 in Indianapolis, in one of the most Democratic districts in the city. Currently the incumbent is leaving, a right-leaning Democrat, and the only candidate running to take her place is currently on a local board of education. Why not give him some competition? I am a professor of sociology/international studies at three local universities (Butler, Marian and IUPUI), so being steeped in the social science research literature I should have the background to provide an intellectual challenge to current ideas about tackling our social and economic problems, which have for far too long been addressed abysmally by market fundamentalists from both parties.

Today began with a meeting with a local political activist who has taken me as a cause and motivated me to stop being lazy. We met today for what I thought would be a discussion about my politics, but turned out to be a day of street canvassing, my first. I thought it would be dreadful, since it is stressful and draining for me to talk to strangers. However, it was actually fun. We canvassed several streets for 5 hours. About half of the houses were vacant, and another quarter appeared to have occupants, but nobody was home. The houses where we actually had people talk to us were exciting, because almost every person signed my petition for candidacy, and many of them had insightful questions, comments, and stories. We were in one of the poorest areas in my district, but also one of the lowest crime rates.

After 20 years of being a religious protester against politics and voting (Mennonite-leaning), ten years of studying the sociology of poverty as a researcher/professor, and two years of living in a blighted area where unemployment, vacant houses, and a government that ignores the poor while subsidizing large corporations, I've come to the realization that while we never read about Jesus advocating that anybody go into public office, he clearly wanted us to serve the poor, and since contemporary U.S. poverty is perpetuated on the structure of poor governance, stepping into governance seems like a good place to start.